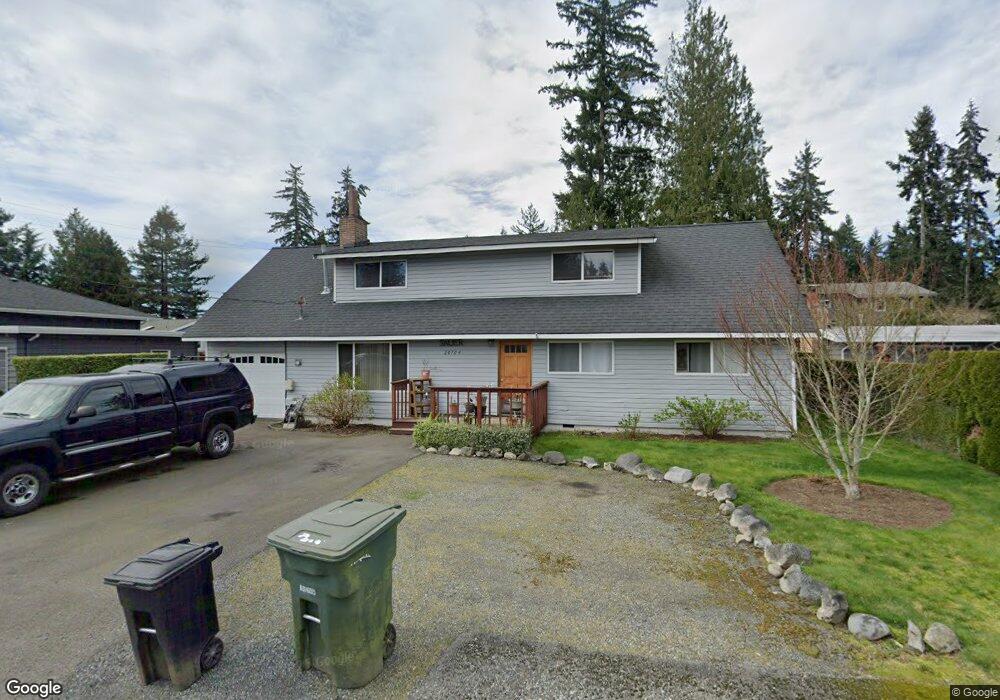
20704 81st Ave W Edmonds, WA 98026
East Edmonds NeighborhoodEstimated Value: $803,000 - $1,058,000
4
Beds
2
Baths
1,745
Sq Ft
$524/Sq Ft
Est. Value
About This Home
This home is located at 20704 81st Ave W, Edmonds, WA 98026 and is currently estimated at $914,937, approximately $524 per square foot. 20704 81st Ave W is a home located in Snohomish County with nearby schools including College Place Elementary School, College Place Middle School, and Edmonds-Woodway High School.
Ownership History
Date
Name
Owned For
Owner Type
Purchase Details
Closed on
Jun 2, 1994
Sold by
Kang Hyon Koo and Kang Kum Ye
Bought by
Sauer Eric B and Sauer Gail P
Current Estimated Value
Home Financials for this Owner
Home Financials are based on the most recent Mortgage that was taken out on this home.
Original Mortgage
$155,040
Interest Rate
8.53%
Mortgage Type
Assumption
Purchase Details
Closed on
May 18, 1994
Sold by
Kang Sung Hye
Bought by
Kang Hyon Koo and Kang Kum Ye
Home Financials for this Owner
Home Financials are based on the most recent Mortgage that was taken out on this home.
Original Mortgage
$155,040
Interest Rate
8.53%
Mortgage Type
Assumption
Purchase Details
Closed on
May 16, 1994
Sold by
Kang Sung Kyu
Bought by
Kang Hyon Koo and Kang Kum Ye
Home Financials for this Owner
Home Financials are based on the most recent Mortgage that was taken out on this home.
Original Mortgage
$155,040
Interest Rate
8.53%
Mortgage Type
Assumption
Create a Home Valuation Report for This Property
The Home Valuation Report is an in-depth analysis detailing your home's value as well as a comparison with similar homes in the area
Home Values in the Area
Average Home Value in this Area
Purchase History
| Date | Buyer | Sale Price | Title Company |
|---|---|---|---|
| Sauer Eric B | $152,000 | Chicago Title Ins Co | |
| Kang Hyon Koo | $31,226 | Western Title Company | |
| Kang Hyon Koo | $31,226 | Western Title Company |
Source: Public Records
Mortgage History
| Date | Status | Borrower | Loan Amount |
|---|---|---|---|
| Closed | Sauer Eric B | $155,040 |
Source: Public Records
Tax History Compared to Growth
Tax History
| Year | Tax Paid | Tax Assessment Tax Assessment Total Assessment is a certain percentage of the fair market value that is determined by local assessors to be the total taxable value of land and additions on the property. | Land | Improvement |
|---|---|---|---|---|
| 2025 | $5,236 | $749,700 | $561,000 | $188,700 |
| 2024 | $5,236 | $741,700 | $553,000 | $188,700 |
| 2023 | $5,445 | $799,300 | $578,000 | $221,300 |
| 2022 | $5,024 | $606,500 | $439,000 | $167,500 |
| 2020 | $4,354 | $468,500 | $344,000 | $124,500 |
| 2019 | $4,052 | $439,500 | $316,000 | $123,500 |
| 2018 | $4,055 | $380,000 | $270,000 | $110,000 |
| 2017 | $3,363 | $330,100 | $233,000 | $97,100 |
| 2016 | $3,076 | $299,300 | $206,000 | $93,300 |
| 2015 | $3,315 | $303,800 | $198,000 | $105,800 |
| 2013 | $2,561 | $221,600 | $131,000 | $90,600 |
Source: Public Records
Map
Nearby Homes
- 20721 81st Ave W
- 8004 203rd Place SW
- 8225 212th St SW Unit 304
- 228 xx 84th Ave W
- 20714 76th Ave W Unit 11
- 20620 76th Ave W Unit A
- 7924 212th St SW Unit 211
- 7924 212th St SW Unit 104
- 8500 Main St Unit F313
- 8500 Main St Unit F-209
- 8500 Main St Unit F205
- 21224 82nd Place W
- 8502 Main St Unit E105
- 20126 81st Ave W
- 7707 203rd St SW
- 20111 80th Ave W
- 7702 202nd Place SW
- 8732 209th Place SW
- 18502 18510 76th Ave W
- 8804 209th Place SW
- 20630 81st Ave W
- 20710 81st Ave W
- 8114 206th St SW
- 20624 81st Ave W
- 8116 206th St SW
- 20703 81st Ave W
- 20722 81st Ave W
- 20629 81st Ave W
- 20709 81st Ave W
- 8118 206th St SW
- 8112 206th St SW
- 20616 81st Ave W
- 20623 81st Ave W
- 20701 82nd Ave W
- 20711 82nd Ave W
- 20631 82nd Ave W
- 20803 82nd Ave W
- 20713 82nd Ave W
- 20625 82nd Ave W
- 20728 81st Ave W