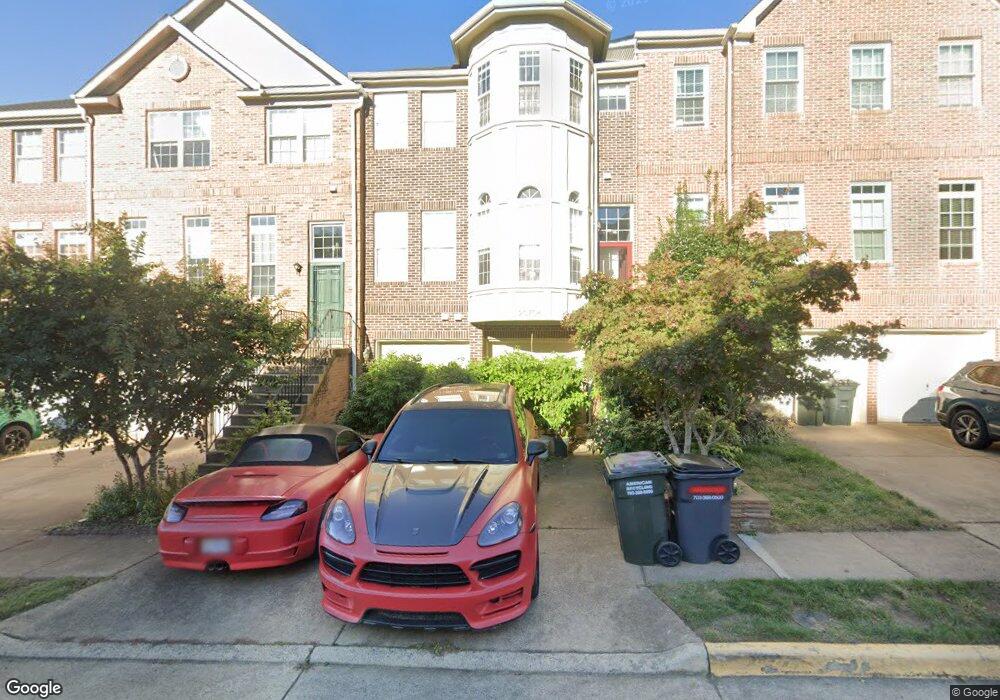
20706 Riptide Square Sterling, VA 20165
Estimated Value: $738,904 - $752,000
3
Beds
4
Baths
2,339
Sq Ft
$318/Sq Ft
Est. Value
About This Home
This home is located at 20706 Riptide Square, Sterling, VA 20165 and is currently estimated at $744,476, approximately $318 per square foot. 20706 Riptide Square is a home located in Loudoun County with nearby schools including Lowes Island Elementary School, Seneca Ridge Middle School, and Dominion High School.
Ownership History
Date
Name
Owned For
Owner Type
Purchase Details
Closed on
Dec 30, 2009
Sold by
Whitmore Christopher
Bought by
Caiazzo Paul C
Current Estimated Value
Home Financials for this Owner
Home Financials are based on the most recent Mortgage that was taken out on this home.
Original Mortgage
$360,900
Outstanding Balance
$235,746
Interest Rate
4.85%
Mortgage Type
New Conventional
Estimated Equity
$508,730
Purchase Details
Closed on
Mar 31, 2000
Sold by
Patton Marvcus
Bought by
Whitmore Christopher and Gardner,Meghan
Home Financials for this Owner
Home Financials are based on the most recent Mortgage that was taken out on this home.
Original Mortgage
$207,900
Interest Rate
8.4%
Purchase Details
Closed on
Aug 7, 1995
Sold by
Windson Dev Corp
Bought by
Patton Marvcus R
Home Financials for this Owner
Home Financials are based on the most recent Mortgage that was taken out on this home.
Original Mortgage
$217,200
Interest Rate
7.48%
Create a Home Valuation Report for This Property
The Home Valuation Report is an in-depth analysis detailing your home's value as well as a comparison with similar homes in the area
Home Values in the Area
Average Home Value in this Area
Purchase History
| Date | Buyer | Sale Price | Title Company |
|---|---|---|---|
| Caiazzo Paul C | $401,000 | -- | |
| Whitmore Christopher | $259,900 | -- | |
| Patton Marvcus R | $228,675 | -- |
Source: Public Records
Mortgage History
| Date | Status | Borrower | Loan Amount |
|---|---|---|---|
| Open | Caiazzo Paul C | $360,900 | |
| Previous Owner | Whitmore Christopher | $207,900 | |
| Previous Owner | Patton Marvcus R | $217,200 |
Source: Public Records
Tax History
| Year | Tax Paid | Tax Assessment Tax Assessment Total Assessment is a certain percentage of the fair market value that is determined by local assessors to be the total taxable value of land and additions on the property. | Land | Improvement |
|---|---|---|---|---|
| 2025 | $5,525 | $686,340 | $220,000 | $466,340 |
| 2024 | $5,840 | $675,130 | $220,000 | $455,130 |
| 2023 | $5,584 | $638,150 | $220,000 | $418,150 |
| 2022 | $5,247 | $589,600 | $195,000 | $394,600 |
| 2021 | $5,023 | $512,540 | $155,000 | $357,540 |
| 2020 | $5,103 | $493,060 | $155,000 | $338,060 |
| 2019 | $4,973 | $475,860 | $155,000 | $320,860 |
| 2018 | $5,034 | $463,930 | $145,000 | $318,930 |
| 2017 | $5,153 | $458,060 | $145,000 | $313,060 |
| 2016 | $5,196 | $453,840 | $0 | $0 |
| 2015 | $5,127 | $306,710 | $0 | $306,710 |
| 2014 | $5,027 | $290,270 | $0 | $290,270 |
Source: Public Records
Map
Nearby Homes
- 47697 Whirlpool Square
- 20660 Muddy Harbour Square
- 20624 Muddy Harbour Square
- 47647 Sandbank Square
- 20818 Blossom Landing Way
- 47807 Blockhouse Point Place
- 20572 Willoughby Square
- 47569 Saulty Dr
- 20630 Bridgeport Ct
- 20500 Tappahannock Place
- 47779 Tupelo Ct
- 47787 Brawner Place
- 20548 Tidewater Ct
- 47456 Sharpskin Island Square
- 20461 Swan Creek Ct
- 11431 Woolington Rd
- 47435 Courtney Ln
- 20443 Cliftons Point St
- 47783 Macgill Ct
- 353 Gallop Wood Place
- 20708 Riptide Square
- 20712 Riptide Square
- 20704 Riptide Square
- 20714 Riptide Square
- 20702 Riptide Square
- 47711 Bowline Terrace
- 20716 Riptide Square
- 47713 Bowline Terrace
- 20709 Riptide Square
- 20707 Riptide Square
- 47715 Bowline Terrace
- 20713 Riptide Square
- 20705 Riptide Square
- 20718 Riptide Square
- 20703 Riptide Square
- 47717 Bowline Terrace
- 20715 Riptide Square
- 20717 Riptide Square
- 20701 Riptide Square
- 47719 Bowline Terrace
Your Personal Tour Guide
Ask me questions while you tour the home.