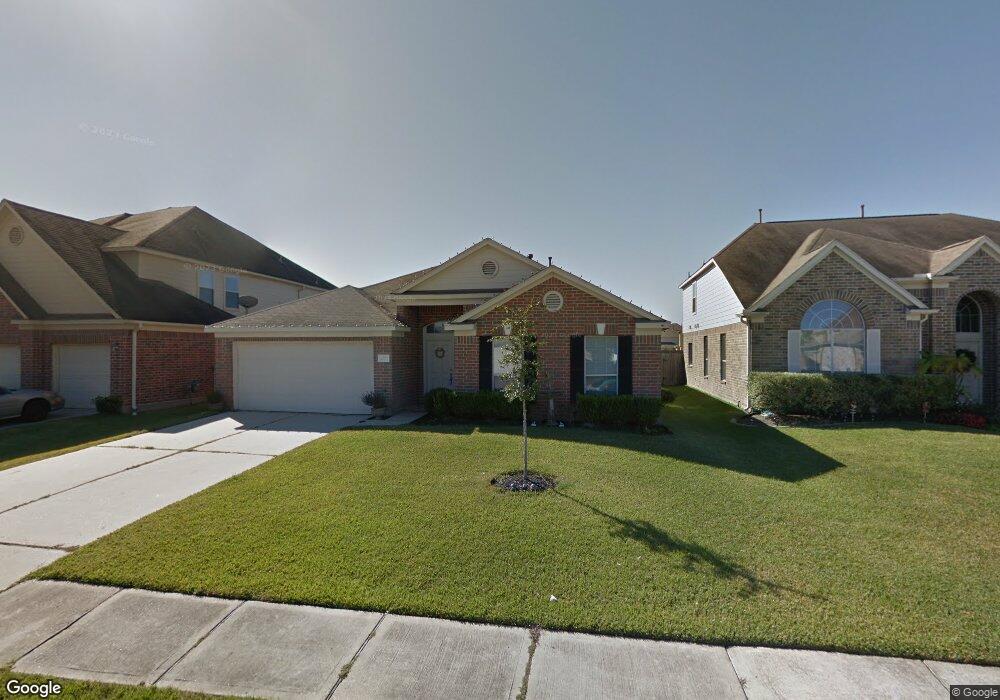
20707 Dappled Ridge Way Humble, TX 77338
Estimated Value: $254,000 - $286,000
4
Beds
2
Baths
2,263
Sq Ft
$121/Sq Ft
Est. Value
About This Home
This home is located at 20707 Dappled Ridge Way, Humble, TX 77338 and is currently estimated at $274,086, approximately $121 per square foot. 20707 Dappled Ridge Way is a home located in Harris County with nearby schools including Cypresswood Elementary School, Jones Middle, and Nimitz Ninth Grade School.
Ownership History
Date
Name
Owned For
Owner Type
Purchase Details
Closed on
Sep 25, 2020
Sold by
Alvarez Cecilia and Alvarez Juan M
Bought by
Nichols Alberta
Current Estimated Value
Home Financials for this Owner
Home Financials are based on the most recent Mortgage that was taken out on this home.
Original Mortgage
$194,000
Outstanding Balance
$172,553
Interest Rate
2.9%
Mortgage Type
New Conventional
Estimated Equity
$101,533
Purchase Details
Closed on
Sep 29, 2006
Sold by
Long Lake Ltd
Bought by
Alvarez Cecilia
Home Financials for this Owner
Home Financials are based on the most recent Mortgage that was taken out on this home.
Original Mortgage
$128,820
Interest Rate
6.47%
Mortgage Type
Purchase Money Mortgage
Purchase Details
Closed on
Jul 28, 2006
Sold by
Woodmere Development Co Ltd
Bought by
Long Lake Ltd
Create a Home Valuation Report for This Property
The Home Valuation Report is an in-depth analysis detailing your home's value as well as a comparison with similar homes in the area
Home Values in the Area
Average Home Value in this Area
Purchase History
| Date | Buyer | Sale Price | Title Company |
|---|---|---|---|
| Nichols Alberta | -- | Infinity Title Company | |
| Nichols Alberta | -- | None Listed On Document | |
| Nichols Alberta | -- | Infinity Title Company | |
| Nichols Alberta | -- | None Listed On Document | |
| Alvarez Cecilia | -- | American Title Co | |
| Long Lake Ltd | -- | American Title Co |
Source: Public Records
Mortgage History
| Date | Status | Borrower | Loan Amount |
|---|---|---|---|
| Open | Nichols Alberta | $194,000 | |
| Closed | Nichols Alberta | $194,000 | |
| Previous Owner | Alvarez Cecilia | $128,820 |
Source: Public Records
Tax History Compared to Growth
Tax History
| Year | Tax Paid | Tax Assessment Tax Assessment Total Assessment is a certain percentage of the fair market value that is determined by local assessors to be the total taxable value of land and additions on the property. | Land | Improvement |
|---|---|---|---|---|
| 2025 | $4,683 | $255,719 | $57,263 | $198,456 |
| 2024 | $4,683 | $255,719 | $46,129 | $209,590 |
| 2023 | $4,683 | $268,078 | $46,129 | $221,949 |
| 2022 | $5,836 | $239,409 | $36,903 | $202,506 |
| 2021 | $5,547 | $200,000 | $36,903 | $163,097 |
| 2020 | $5,550 | $190,974 | $36,903 | $154,071 |
| 2019 | $5,380 | $183,538 | $36,903 | $146,635 |
| 2018 | $1,963 | $161,700 | $36,903 | $124,797 |
| 2017 | $4,530 | $170,838 | $36,903 | $133,935 |
| 2016 | $4,118 | $140,722 | $15,907 | $124,815 |
| 2015 | $3,371 | $140,722 | $15,907 | $124,815 |
| 2014 | $3,371 | $129,053 | $15,907 | $113,146 |
Source: Public Records
Map
Nearby Homes
- 20702 Dappled Ridge Way
- 6614 Early Fall Dr
- 20510 Wren Hollow Way
- 6615 Level Pond Ln
- 20403 Jasmine Leaf Trail
- 20714 Quartz Creek Ln
- 20623 Falling Cypress Ct
- 6815 Maize Clearing Trail
- 20738 Quartz Creek Ln
- 6747 Old Cypress Landing Ln
- 20410 Fall Foliage Dr
- 6935 Foxbrook Dr
- 6030 Patriot Sound Rd
- 5927 Patriot Sound Dr
- 6003 Patriot Sound Dr
- 6907 Foxhurst Ln
- 5938 Patriot Sound Dr
- 5814 Patriot Sound Dr
- 5806 Dr
- 5934 Patriot Sound Dr
- 20711 Dappled Ridge Way
- 20703 Dappled Ridge Way
- 6515 Green Summer Ln
- 20715 Dappled Ridge Way
- 6514 Early Fall Dr
- 6511 Green Summer Ln
- 20706 Dappled Ridge Way
- 20710 Dappled Ridge Way
- 6510 Early Fall Dr
- 6530 Green Summer Ln
- 20714 Dappled Ridge Way
- 6526 Green Summer Ln
- 6507 Green Summer Ln
- 6522 Green Summer Ln
- 20723 Dappled Ridge Way
- 6602 Green Summer Ln
- 6611 Green Summer Ln
- 20610 Wren Hollow Way
- 6506 Early Fall Dr
- 6610 Early Fall Dr