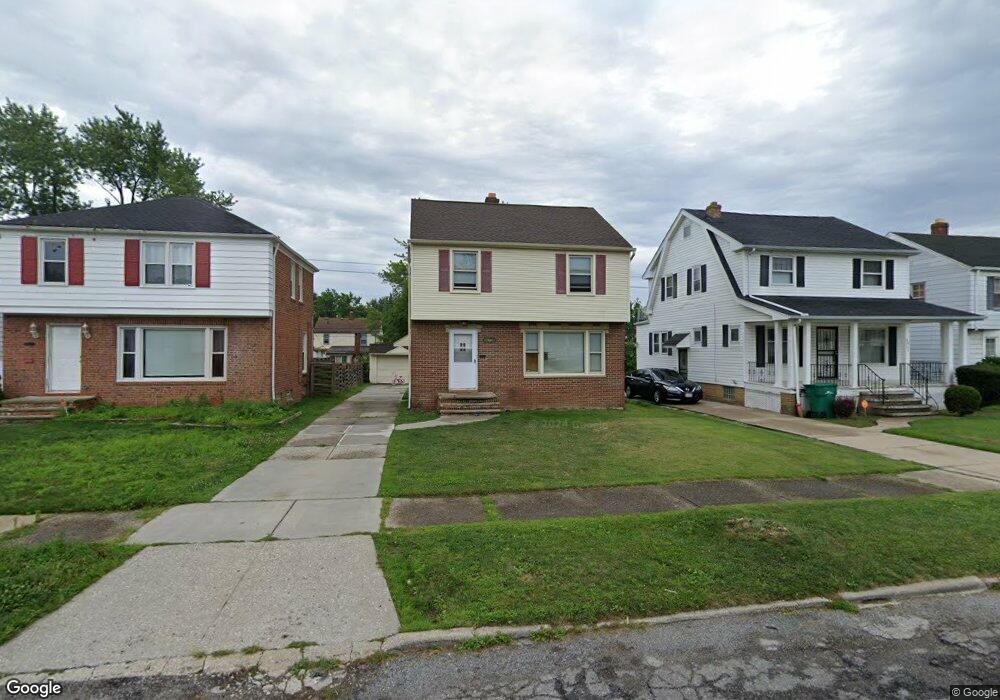
20708 Hillgrove Ave Maple Heights, OH 44137
Estimated Value: $99,000 - $131,000
3
Beds
1
Bath
1,299
Sq Ft
$88/Sq Ft
Est. Value
About This Home
This home is located at 20708 Hillgrove Ave, Maple Heights, OH 44137 and is currently estimated at $114,272, approximately $87 per square foot. 20708 Hillgrove Ave is a home located in Cuyahoga County with nearby schools including Abraham Lincoln Elementary School, Rockside/ J.F. Kennedy School, and Italy High School.
Ownership History
Date
Name
Owned For
Owner Type
Purchase Details
Closed on
Nov 28, 2016
Sold by
Blythewood Jacquelne
Bought by
Blythewood Thomas O
Current Estimated Value
Purchase Details
Closed on
Feb 2, 2011
Sold by
Federal Home Loan Mortgage Corporation
Bought by
1St Light Properties Llc
Purchase Details
Closed on
Jan 20, 2010
Sold by
James Judy L
Bought by
Federal Home Loan Mortgage Corp
Purchase Details
Closed on
Aug 5, 1987
Sold by
Schweitzer June
Bought by
James Judy L
Purchase Details
Closed on
Jun 23, 1983
Sold by
Schweitzer Roy C
Bought by
Schweitzer June
Purchase Details
Closed on
Mar 4, 1982
Sold by
Schweitzer Roy C and Schweitzer June
Bought by
Schweitzer Roy C
Purchase Details
Closed on
Jan 1, 1975
Bought by
Schweitzer Roy C and Schweitzer June
Create a Home Valuation Report for This Property
The Home Valuation Report is an in-depth analysis detailing your home's value as well as a comparison with similar homes in the area
Home Values in the Area
Average Home Value in this Area
Purchase History
| Date | Buyer | Sale Price | Title Company |
|---|---|---|---|
| Blythewood Thomas O | -- | None Available | |
| 1St Light Properties Llc | $19,105 | Community First Title | |
| Federal Home Loan Mortgage Corp | $50,000 | Attorney | |
| James Judy L | $53,400 | -- | |
| Schweitzer June | -- | -- | |
| Schweitzer Roy C | -- | -- | |
| Schweitzer Roy C | -- | -- |
Source: Public Records
Tax History Compared to Growth
Tax History
| Year | Tax Paid | Tax Assessment Tax Assessment Total Assessment is a certain percentage of the fair market value that is determined by local assessors to be the total taxable value of land and additions on the property. | Land | Improvement |
|---|---|---|---|---|
| 2024 | $3,332 | $36,190 | $6,720 | $29,470 |
| 2023 | $2,236 | $20,200 | $4,060 | $16,140 |
| 2022 | $2,229 | $20,195 | $4,060 | $16,135 |
| 2021 | $2,376 | $20,200 | $4,060 | $16,140 |
| 2020 | $2,033 | $15,300 | $3,080 | $12,220 |
| 2019 | $2,022 | $43,700 | $8,800 | $34,900 |
| 2018 | $1,549 | $15,300 | $3,080 | $12,220 |
| 2017 | $1,030 | $6,130 | $2,870 | $3,260 |
| 2016 | $996 | $6,130 | $2,870 | $3,260 |
| 2015 | $1,441 | $6,130 | $2,870 | $3,260 |
| 2014 | $962 | $6,720 | $3,150 | $3,570 |
Source: Public Records
Map
Nearby Homes
- 20701 Kenyon Dr
- 20814 Kenyon Dr
- 20510 Mountville Dr
- 20814 Watson Rd
- 21102 Raymond St
- 20715 Watson Rd
- 20907 Watson Rd
- 20107 Libby Rd
- 21207 Franklin Rd
- 19807 Gardenview Dr
- 19806 Mountville Dr
- 20120 Mccracken Rd
- 21416 Gardenview Dr
- 19812 Stockton Ave
- 19520 Maple Heights Blvd
- 19289 Stafford Ave
- 5165 Camden Rd
- 19309 Nitra Ave
- 20625 Centuryway Rd
- 19221 Stafford Ave
- 20712 Hillgrove Ave
- 20706 Hillgrove Ave
- 20716 Hillgrove Ave
- 20700 Hillgrove Ave
- 20802 Hillgrove Ave
- 20711 Clare Ave
- 20715 Clare Ave
- 20707 Clare Ave
- 20719 Clare Ave
- 20703 Clare Ave
- 20804 Hillgrove Ave
- 20803 Clare Ave
- 20711 Hillgrove Ave
- 20713 Hillgrove Ave
- 20709 Hillgrove Ave
- 20616 Hillgrove 3 4fb
- 20616 Hillgrove Ave
- 20717 Hillgrove Ave
- 20703 Hillgrove Ave
- 20808 Hillgrove Ave