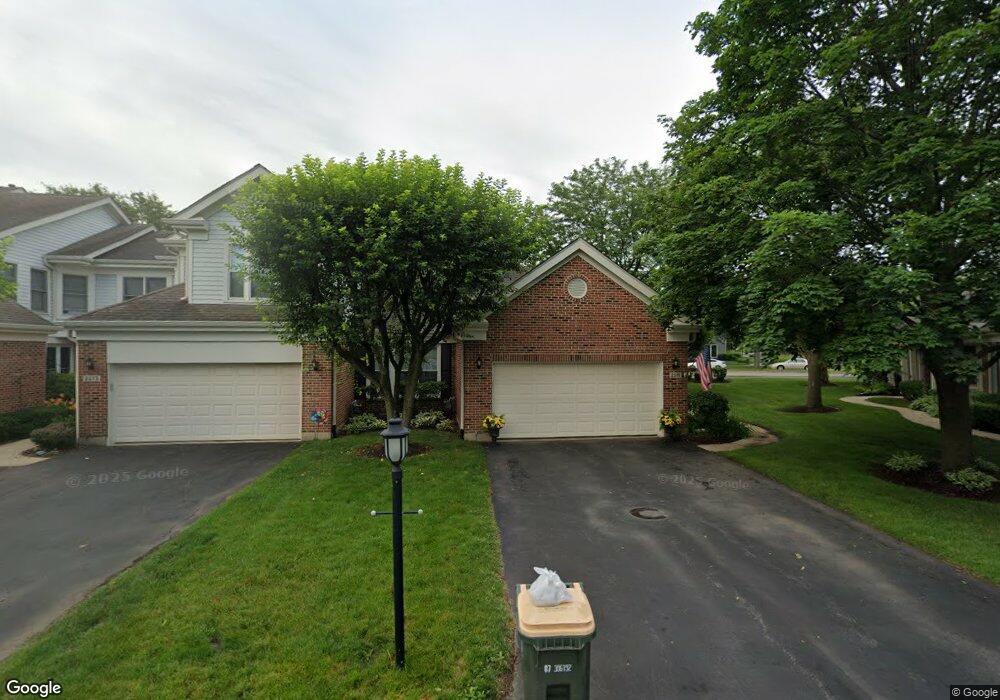
2071 N Charter Point Dr Unit 12 Arlington Heights, IL 60004
Estimated Value: $394,640 - $499,000
2
Beds
--
Bath
8,750
Sq Ft
$50/Sq Ft
Est. Value
About This Home
This home is located at 2071 N Charter Point Dr Unit 12, Arlington Heights, IL 60004 and is currently estimated at $436,410, approximately $49 per square foot. 2071 N Charter Point Dr Unit 12 is a home located in Cook County with nearby schools including Dwight D Eisenhower Elementary School, Anne Sullivan Elementary School, and Betsy Ross Elementary School.
Ownership History
Date
Name
Owned For
Owner Type
Purchase Details
Closed on
Jun 15, 2015
Sold by
Zdeb Dolores M
Bought by
Cooney Andrea
Current Estimated Value
Home Financials for this Owner
Home Financials are based on the most recent Mortgage that was taken out on this home.
Original Mortgage
$195,000
Outstanding Balance
$151,033
Interest Rate
3.75%
Mortgage Type
New Conventional
Estimated Equity
$285,377
Purchase Details
Closed on
Mar 31, 2006
Sold by
Zdeb Carl A and Zdeb Dolores M
Bought by
Zdeb Dolores and Zdeb Carl
Purchase Details
Closed on
Feb 17, 1997
Sold by
Lizak Jacqueline Ann and Lizak Jacqueline Anne
Bought by
Zdeb Carl A and Zdeb Dolores M
Home Financials for this Owner
Home Financials are based on the most recent Mortgage that was taken out on this home.
Original Mortgage
$200,000
Interest Rate
6.25%
Create a Home Valuation Report for This Property
The Home Valuation Report is an in-depth analysis detailing your home's value as well as a comparison with similar homes in the area
Home Values in the Area
Average Home Value in this Area
Purchase History
| Date | Buyer | Sale Price | Title Company |
|---|---|---|---|
| Cooney Andrea | $275,000 | Attorneys Title Guaranty Fun | |
| Zdeb Dolores | -- | None Available | |
| Zdeb Carl A | $250,000 | Attorneys Natl Title Network |
Source: Public Records
Mortgage History
| Date | Status | Borrower | Loan Amount |
|---|---|---|---|
| Open | Cooney Andrea | $195,000 | |
| Previous Owner | Zdeb Carl A | $200,000 |
Source: Public Records
Tax History Compared to Growth
Tax History
| Year | Tax Paid | Tax Assessment Tax Assessment Total Assessment is a certain percentage of the fair market value that is determined by local assessors to be the total taxable value of land and additions on the property. | Land | Improvement |
|---|---|---|---|---|
| 2024 | $8,144 | $29,798 | $10,079 | $19,719 |
| 2023 | $7,777 | $29,798 | $10,079 | $19,719 |
| 2022 | $7,777 | $29,798 | $10,079 | $19,719 |
| 2021 | $7,669 | $25,231 | $1,048 | $24,183 |
| 2020 | $7,465 | $25,231 | $1,048 | $24,183 |
| 2019 | $7,464 | $28,220 | $1,048 | $27,172 |
| 2018 | $6,799 | $23,350 | $838 | $22,512 |
| 2017 | $6,728 | $23,350 | $838 | $22,512 |
| 2016 | $6,267 | $23,350 | $838 | $22,512 |
| 2015 | $6,402 | $21,543 | $5,248 | $16,295 |
| 2014 | $5,040 | $21,543 | $5,248 | $16,295 |
| 2013 | $4,681 | $21,543 | $5,248 | $16,295 |
Source: Public Records
Map
Nearby Homes
- 2026 N Stillwater Rd Unit 24
- 1956 N Silver Lake Rd
- 1912 N Coldspring Rd Unit 96
- 1949 N Charter Point Dr Unit 1949
- 307 Anne Ct
- 1044 Creekside Ct Unit 2B
- 11 W Palatine Rd
- 802 Andover Ct
- 1500 Harbour Dr Unit 2K
- 1500 Harbour Dr Unit 1D
- 105 W Ridge Ave
- 412 Cherry Creek Ln
- 21 E Stonegate Dr
- 2143 E Peachtree Ln
- 2611 E Radford Ct
- 13 W Kenilworth Ave
- 1014 N Elmhurst Rd
- 9 Kenneth Ave
- 1201 Pleasant Run Dr Unit 312
- 1519 E Arbor Ln
- 2073 N Charter Point Dr Unit 12
- 2075 N Charter Point Dr Unit 12
- 2069 N Charter Point Dr Unit 13
- 2077 N Charter Point Dr Unit 12
- 2067 N Charter Point Dr Unit 13
- 2065 N Charter Point Dr Unit 13
- 2079 N Charter Point Dr Unit 12
- 2063 N Charter Point Dr Unit 13
- 2078 N Charter Point Dr Unit 15
- 2081 N Charter Point Dr Unit 11
- 2080 N Charter Point Dr Unit 16
- 2061 N Charter Point Dr Unit 13
- 2076 N Charter Point Dr Unit 15
- 2083 N Charter Point Dr Unit 11
- 2030 N Stillwater Rd Unit 26
- 2028 N Stillwater Rd Unit 25
- 2024 N Stillwater Rd Unit 23
- 2032 N Stillwater Rd Unit 28
- 2034 N Stillwater Rd Unit 27
- 2074 N Charter Point Dr Unit 15