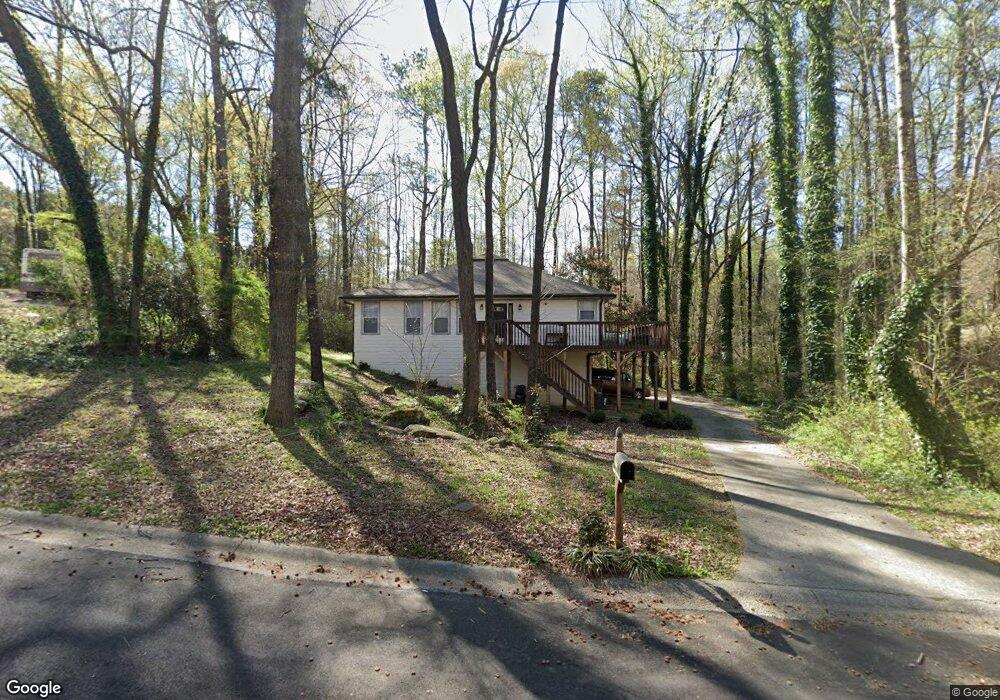
2071 Peridot Ct Unit 19 Jonesboro, GA 30236
Estimated Value: $226,000 - $280,000
3
Beds
2
Baths
1,600
Sq Ft
$160/Sq Ft
Est. Value
About This Home
This home is located at 2071 Peridot Ct Unit 19, Jonesboro, GA 30236 and is currently estimated at $255,490, approximately $159 per square foot. 2071 Peridot Ct Unit 19 is a home located in Clayton County with nearby schools including Mt. Zion Primary School, Mount Zion Elementary School, and M. D. Roberts Middle School.
Ownership History
Date
Name
Owned For
Owner Type
Purchase Details
Closed on
Apr 30, 2021
Sold by
Southern State Investments Llc
Bought by
Heard Enterprise Holdings Llc
Current Estimated Value
Home Financials for this Owner
Home Financials are based on the most recent Mortgage that was taken out on this home.
Original Mortgage
$185,500
Outstanding Balance
$168,109
Interest Rate
3.1%
Mortgage Type
New Conventional
Estimated Equity
$87,381
Purchase Details
Closed on
Nov 5, 1998
Sold by
Simmons Nancy C
Bought by
Harper Jr Hiram and Harper Jr Norma L
Home Financials for this Owner
Home Financials are based on the most recent Mortgage that was taken out on this home.
Original Mortgage
$90,900
Interest Rate
6.77%
Mortgage Type
New Conventional
Create a Home Valuation Report for This Property
The Home Valuation Report is an in-depth analysis detailing your home's value as well as a comparison with similar homes in the area
Home Values in the Area
Average Home Value in this Area
Purchase History
| Date | Buyer | Sale Price | Title Company |
|---|---|---|---|
| Heard Enterprise Holdings Llc | $168,000 | -- | |
| Southern State Investments Llc | $140,000 | -- | |
| Harper Jr Hiram | $107,000 | -- |
Source: Public Records
Mortgage History
| Date | Status | Borrower | Loan Amount |
|---|---|---|---|
| Open | Southern State Investments Llc | $185,500 | |
| Closed | Heard Enterprise Holdings Llc | $185,500 | |
| Previous Owner | Harper Jr Hiram | $90,900 |
Source: Public Records
Tax History Compared to Growth
Tax History
| Year | Tax Paid | Tax Assessment Tax Assessment Total Assessment is a certain percentage of the fair market value that is determined by local assessors to be the total taxable value of land and additions on the property. | Land | Improvement |
|---|---|---|---|---|
| 2024 | $3,343 | $87,360 | $7,200 | $80,160 |
| 2023 | $5,881 | $80,480 | $7,200 | $73,280 |
| 2022 | $2,597 | $65,280 | $7,200 | $58,080 |
| 2021 | $2,258 | $56,280 | $7,200 | $49,080 |
| 2020 | $2,057 | $50,549 | $7,200 | $43,349 |
| 2019 | $1,854 | $44,810 | $7,200 | $37,610 |
| 2018 | $1,812 | $43,767 | $7,200 | $36,567 |
| 2017 | $1,594 | $38,314 | $7,200 | $31,114 |
| 2016 | $1,609 | $38,680 | $7,200 | $31,480 |
| 2015 | $1,597 | $0 | $0 | $0 |
| 2014 | $581 | $37,478 | $7,200 | $30,278 |
Source: Public Records
Map
Nearby Homes
- 2084 Jadestone Ct
- 7583 Sunstone Dr
- 2115 Logan Dr
- 1938 Wrights Way
- 2254 Lisbon Ln
- 2238 Danver Ct
- 7455 Page Ct
- 7621 Raleigh Ln
- 2282 Tiffany Ct
- 7519 Conkle Rd Unit 2
- 7581 Livingston Dr
- 7475 Danielle Ct
- 1837 Coventry Way
- 7672 Echo Ln
- 7326 Leland Ln
- 2158 Weybridge Dr
- 7620 Mount Zion Blvd
- 1904 Cades Cove
- 2173 Martin Way
- 2071 Peridot Ct
- 2084 Jadestone Ct Unit 21
- 2070 Peridot Ct
- 2076 Jadestone Ct Unit 20
- 2087 Peridot Ct
- 0 Diamond Ct Unit 8403583
- 2054 Diamond Ct
- 0 Diamond Dr Unit 1-75 7114572
- 0 Diamond Dr Unit 8348634
- 0 Diamond Dr Unit 8558551
- 7573 Sunstone Dr
- 2086 Peridot Ct
- 2088 Jadestone Ct
- 2075 Jadestone Ct
- 2042 Diamond Ct
- 7595 Sunstone Dr Unit 2
- 2078 Tiffany Ln Unit 3
- 2085 Jadestone Ct
- 2074 Tiffany Ln
- 2082 Tiffany Ln