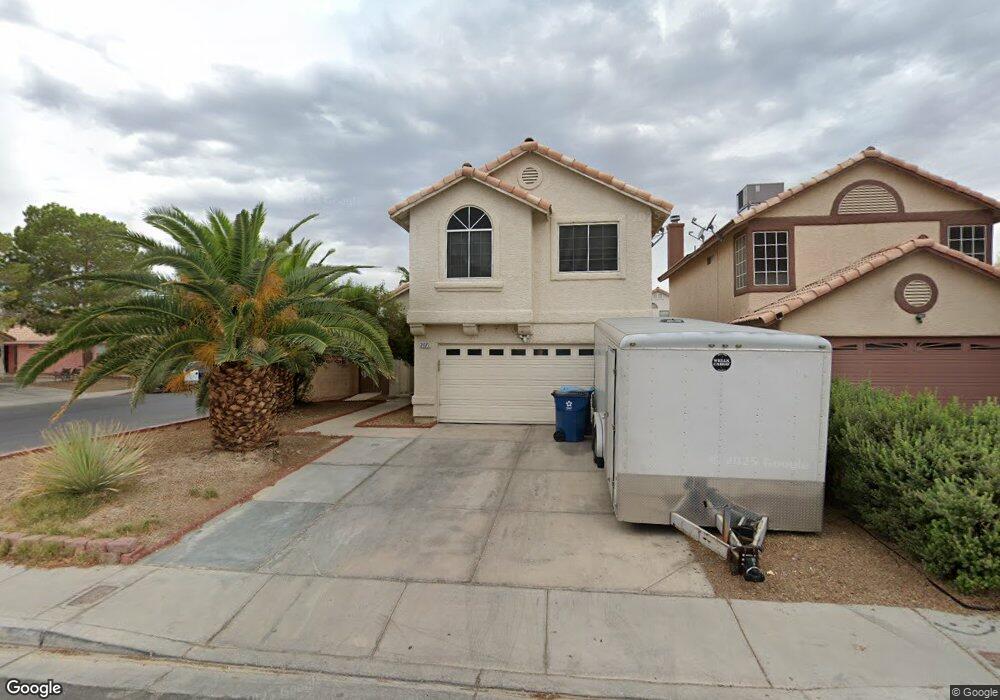
2071 Turtlerock St Las Vegas, NV 89142
Estimated Value: $391,000 - $423,153
4
Beds
3
Baths
1,842
Sq Ft
$222/Sq Ft
Est. Value
About This Home
This home is located at 2071 Turtlerock St, Las Vegas, NV 89142 and is currently estimated at $409,788, approximately $222 per square foot. 2071 Turtlerock St is a home located in Clark County with nearby schools including John F. Mendoza Elementary School, Duane D. Keller Middle School, and Las Vegas High School.
Ownership History
Date
Name
Owned For
Owner Type
Purchase Details
Closed on
Aug 10, 2017
Sold by
Blue Spring Investments Llc
Bought by
Martinez Alexander
Current Estimated Value
Home Financials for this Owner
Home Financials are based on the most recent Mortgage that was taken out on this home.
Original Mortgage
$175,518
Interest Rate
3.75%
Mortgage Type
FHA
Purchase Details
Closed on
Jun 9, 2011
Sold by
Giddinge Michael L and Giddinge Eva B
Bought by
Blue Springs Investments Llc
Purchase Details
Closed on
Mar 10, 2003
Sold by
Giddinge Eva B
Bought by
Giddinge Michael L
Home Financials for this Owner
Home Financials are based on the most recent Mortgage that was taken out on this home.
Original Mortgage
$113,000
Interest Rate
5.83%
Create a Home Valuation Report for This Property
The Home Valuation Report is an in-depth analysis detailing your home's value as well as a comparison with similar homes in the area
Home Values in the Area
Average Home Value in this Area
Purchase History
| Date | Buyer | Sale Price | Title Company |
|---|---|---|---|
| Martinez Alexander | $190,000 | North American Title Main | |
| Blue Springs Investments Llc | $117,000 | Ticor Title Las Vegas | |
| Giddinge Michael L | -- | First American Title Company |
Source: Public Records
Mortgage History
| Date | Status | Borrower | Loan Amount |
|---|---|---|---|
| Previous Owner | Martinez Alexander | $175,518 | |
| Previous Owner | Giddinge Michael L | $113,000 |
Source: Public Records
Tax History Compared to Growth
Tax History
| Year | Tax Paid | Tax Assessment Tax Assessment Total Assessment is a certain percentage of the fair market value that is determined by local assessors to be the total taxable value of land and additions on the property. | Land | Improvement |
|---|---|---|---|---|
| 2025 | $1,370 | $81,721 | $22,750 | $58,971 |
| 2024 | $1,331 | $81,721 | $22,750 | $58,971 |
| 2023 | $1,331 | $84,954 | $28,700 | $56,254 |
| 2022 | $1,417 | $73,047 | $21,000 | $52,047 |
| 2021 | $1,312 | $68,658 | $18,900 | $49,758 |
| 2020 | $1,215 | $68,294 | $18,550 | $49,744 |
| 2019 | $1,139 | $63,213 | $14,000 | $49,213 |
| 2018 | $1,087 | $60,711 | $13,300 | $47,411 |
| 2017 | $1,756 | $59,865 | $11,550 | $48,315 |
| 2016 | $1,018 | $55,612 | $7,350 | $48,262 |
| 2015 | $1,015 | $40,290 | $6,300 | $33,990 |
| 2014 | $984 | $32,542 | $5,250 | $27,292 |
Source: Public Records
Map
Nearby Homes
- 1950 Turtlerock St
- 2179 Raspberry Hill Rd
- 2307 Tuscarora Ct
- 1927 Raspberry Hill Rd
- 5849 Emerald Canyon Dr
- 1747 Angel Falls St
- 6131 Pumpkin Patch Ave
- 6028 Las Nubes Dr
- 6080 Saint Petersburg Dr
- 2229 Bowstring Dr
- 1631 Mapleleaf St
- 1779 Pineapple Tree Ct
- 6092 Golden Nectar Way
- 6170 E Sahara Ave Unit 1031
- 6170 E Sahara Ave Unit 1076
- 6170 E Sahara Ave Unit 1111
- 5650 E Sahara Ave Unit 2010
- 5650 E Sahara Ave Unit 2007
- 5650 E Sahara Ave Unit 1035
- 6233 Apple Orchard Dr
- 2061 Turtlerock St
- 2072 Falcon Ridge St
- 2062 Falcon Ridge St
- 2041 Turtlerock St
- 5919 Bonita Canyon Ave
- 5927 Bonita Canyon Ave
- 2052 Falcon Ridge St
- 5911 Bonita Canyon Ave
- 5935 Bonita Canyon Ave
- 2070 Turtlerock St
- 2060 Turtlerock St
- 5899 Bonita Canyon Ave
- 2042 Falcon Ridge St
- 2031 Turtlerock St
- 5943 Bonita Canyon Ave
- 2050 Turtlerock St
- 2040 Turtlerock St
- 2032 Falcon Ridge St
- 5951 Bonita Canyon Ave
- 5891 Bonita Canyon Ave