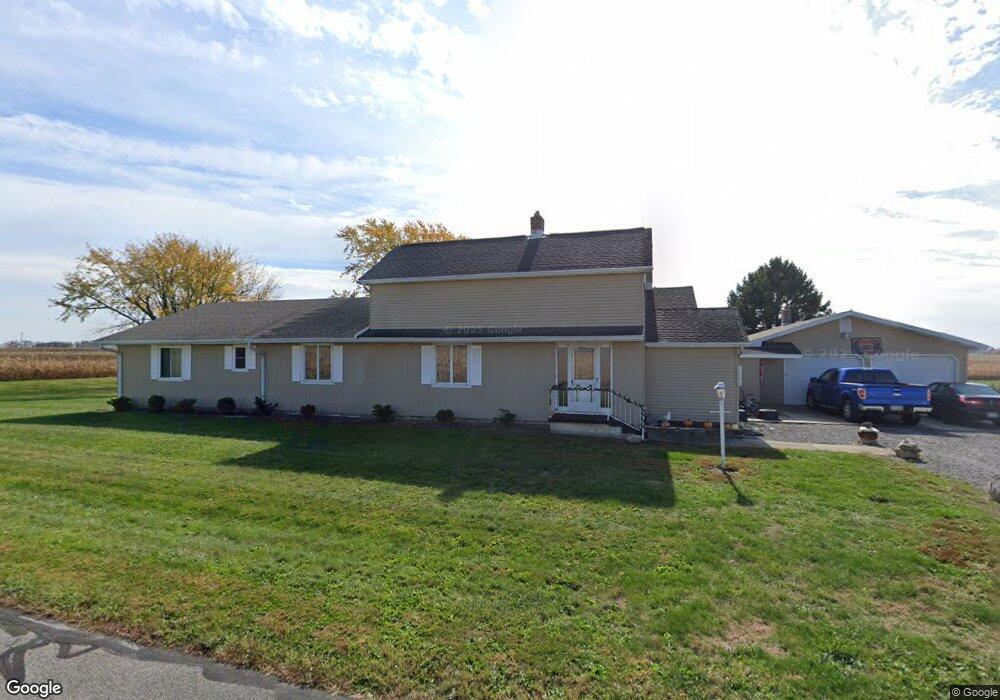
20712 Gutman Rd Wapakoneta, OH 45895
Estimated Value: $162,000 - $397,000
2
Beds
1
Bath
2,180
Sq Ft
$113/Sq Ft
Est. Value
About This Home
This home is located at 20712 Gutman Rd, Wapakoneta, OH 45895 and is currently estimated at $246,674, approximately $113 per square foot. 20712 Gutman Rd is a home with nearby schools including Wapakoneta Elementary School, Wapakoneta High School, and Wapakoneta Middle School.
Ownership History
Date
Name
Owned For
Owner Type
Purchase Details
Closed on
Nov 21, 2016
Sold by
Rohm Joy K
Bought by
Randall Gabriel J and Randall Tiffany R
Current Estimated Value
Home Financials for this Owner
Home Financials are based on the most recent Mortgage that was taken out on this home.
Original Mortgage
$134,500
Outstanding Balance
$63,840
Interest Rate
3.47%
Mortgage Type
Closed End Mortgage
Estimated Equity
$182,834
Purchase Details
Closed on
Sep 22, 2016
Sold by
Rohm Joy K
Bought by
Rohm Matthew J and Rohm Sharon J
Home Financials for this Owner
Home Financials are based on the most recent Mortgage that was taken out on this home.
Original Mortgage
$134,500
Outstanding Balance
$63,840
Interest Rate
3.47%
Mortgage Type
Closed End Mortgage
Estimated Equity
$182,834
Purchase Details
Closed on
Jan 23, 2014
Sold by
Fritz Donna
Bought by
Rohm Joy and Rohm Keith
Purchase Details
Closed on
Mar 4, 2002
Sold by
Fritz John H
Bought by
Rohm Joy and Rohm Keith
Create a Home Valuation Report for This Property
The Home Valuation Report is an in-depth analysis detailing your home's value as well as a comparison with similar homes in the area
Home Values in the Area
Average Home Value in this Area
Purchase History
| Date | Buyer | Sale Price | Title Company |
|---|---|---|---|
| Randall Gabriel J | $100,000 | None Available | |
| Rohm Matthew J | -- | Attorney | |
| Rohm Joy | -- | Attorney | |
| Rohm Joy | -- | -- |
Source: Public Records
Mortgage History
| Date | Status | Borrower | Loan Amount |
|---|---|---|---|
| Open | Randall Gabriel J | $134,500 |
Source: Public Records
Tax History Compared to Growth
Tax History
| Year | Tax Paid | Tax Assessment Tax Assessment Total Assessment is a certain percentage of the fair market value that is determined by local assessors to be the total taxable value of land and additions on the property. | Land | Improvement |
|---|---|---|---|---|
| 2024 | $2,495 | $48,820 | $18,820 | $30,000 |
| 2023 | $1,653 | $48,820 | $18,820 | $30,000 |
| 2022 | $1,124 | $29,610 | $11,360 | $18,250 |
| 2021 | $1,107 | $29,610 | $11,360 | $18,250 |
| 2020 | $1,098 | $29,610 | $11,361 | $18,249 |
| 2019 | $1,100 | $29,610 | $11,361 | $18,249 |
| 2018 | $1,101 | $29,883 | $11,361 | $18,522 |
| 2017 | $1,153 | $29,883 | $11,361 | $18,522 |
| 2016 | $4,504 | $139,325 | $120,638 | $18,687 |
| 2015 | $4,411 | $139,325 | $120,638 | $18,687 |
| 2014 | $4,476 | $139,325 | $120,638 | $18,687 |
| 2013 | $1,493 | $102,015 | $83,328 | $18,687 |
Source: Public Records
Map
Nearby Homes
- 20878 Gutman Rd
- 11802 Kuenstle Rd
- 21112 Gutman Rd
- 11774 Kuenstle Rd
- 11700 Kuenstle Rd
- 11591 Kuenstle Rd
- 11736 Kuenstle Rd
- 12257 Kuenstle Rd
- 21263 Gutman Rd
- 10251 Kuenstle Rd
- 11631 State Route 65
- 11131 State Route 65
- 11659 State Route 65
- 11486 State Route 65
- 11713 State Route 65
- 11245 State Route 65
- 21039 Geyer Dr
- 21109 Geyer Dr
- 20944 Geyer Dr
- 11171 State Route 65