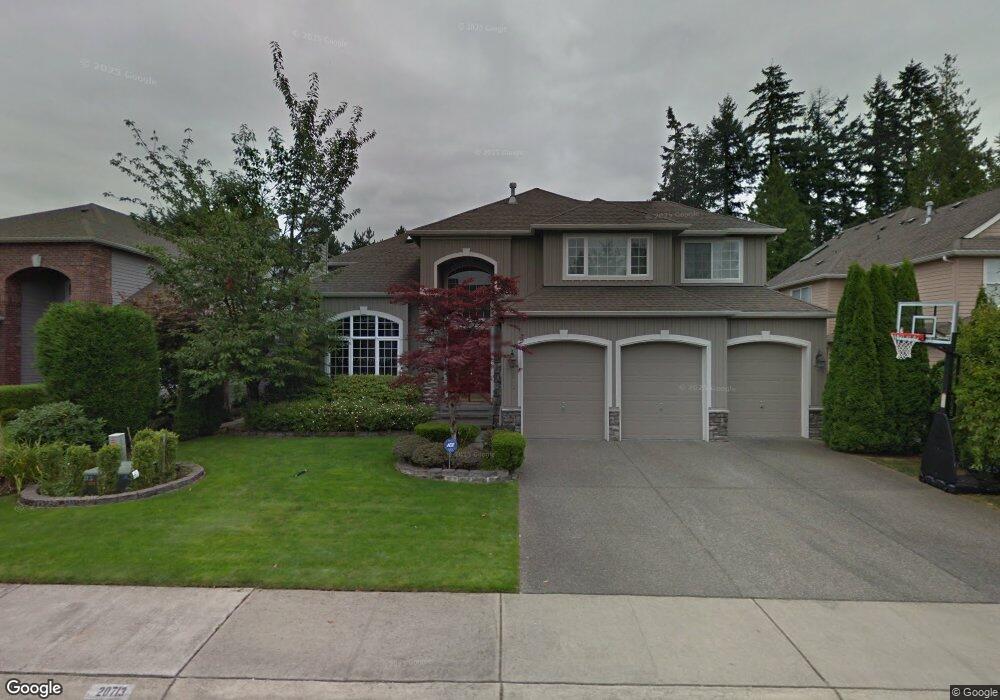
20713 40th Dr SE Bothell, WA 98021
Canyon Creek NeighborhoodEstimated Value: $1,534,000 - $1,755,000
4
Beds
3
Baths
3,433
Sq Ft
$463/Sq Ft
Est. Value
About This Home
This home is located at 20713 40th Dr SE, Bothell, WA 98021 and is currently estimated at $1,589,541, approximately $463 per square foot. 20713 40th Dr SE is a home located in Snohomish County with nearby schools including Canyon Creek Elementary School, Skyview Middle School, and North Creek High School.
Ownership History
Date
Name
Owned For
Owner Type
Purchase Details
Closed on
Aug 16, 2010
Sold by
Pirak Dwayne A and Pirak Jennifer G
Bought by
Brown Shawn and Brown Kristen
Current Estimated Value
Home Financials for this Owner
Home Financials are based on the most recent Mortgage that was taken out on this home.
Original Mortgage
$421,600
Outstanding Balance
$271,819
Interest Rate
4.52%
Mortgage Type
New Conventional
Estimated Equity
$1,317,722
Purchase Details
Closed on
Oct 19, 2000
Sold by
Countrywood Homes Inc
Bought by
Pirak Dwayne A and Pirak Jennifer G
Home Financials for this Owner
Home Financials are based on the most recent Mortgage that was taken out on this home.
Original Mortgage
$354,350
Interest Rate
7.89%
Create a Home Valuation Report for This Property
The Home Valuation Report is an in-depth analysis detailing your home's value as well as a comparison with similar homes in the area
Home Values in the Area
Average Home Value in this Area
Purchase History
| Date | Buyer | Sale Price | Title Company |
|---|---|---|---|
| Brown Shawn | $527,000 | Chicago Title | |
| Pirak Dwayne A | $442,990 | Chicago Title Insurance Co |
Source: Public Records
Mortgage History
| Date | Status | Borrower | Loan Amount |
|---|---|---|---|
| Open | Brown Shawn | $421,600 | |
| Previous Owner | Pirak Dwayne A | $354,350 | |
| Closed | Pirak Dwayne A | $22,100 |
Source: Public Records
Tax History
| Year | Tax Paid | Tax Assessment Tax Assessment Total Assessment is a certain percentage of the fair market value that is determined by local assessors to be the total taxable value of land and additions on the property. | Land | Improvement |
|---|---|---|---|---|
| 2026 | $11,714 | $1,429,400 | $819,600 | $609,800 |
| 2025 | $10,619 | $1,311,100 | $725,000 | $586,100 |
| 2024 | $10,619 | $1,188,400 | $635,000 | $553,400 |
| 2023 | $10,937 | $1,364,900 | $735,000 | $629,900 |
| 2022 | $9,923 | $984,700 | $450,000 | $534,700 |
| 2020 | $9,351 | $876,000 | $414,000 | $462,000 |
| 2019 | $8,209 | $777,600 | $330,000 | $447,600 |
| 2018 | $7,759 | $684,400 | $285,000 | $399,400 |
| 2017 | $6,712 | $602,500 | $230,000 | $372,500 |
| 2016 | $6,519 | $571,300 | $210,000 | $361,300 |
| 2015 | $6,371 | $530,400 | $195,000 | $335,400 |
| 2013 | $5,612 | $415,600 | $143,100 | $272,500 |
Source: Public Records
Map
Nearby Homes
- 3928 214th Place SE Unit B
- 20327 45th Dr SE
- 3918 214th Place SE Unit A
- 4001 215th St SE Unit A
- 21417 43rd Dr SE Unit 19
- 3323 207th Place SE
- 3618 202nd St SE
- 4026 215th Place SE
- 4010 199th Place SE
- 3924 190th Place SE
- 19923 40th Dr SE
- 3912 199th Place SE
- 4014 199th Place SE
- 3916 199th Place SE
- 3422 201st Place SE
- 3908 199th SE
- 4013 199th Place SE
- 4009 199th Place SE
- 4005 199th Place SE
- 20500 32nd Dr SE
- 20717 40th Dr SE
- 20709 40th Dr SE
- 20705 40th Dr SE
- 20721 40th Dr SE
- 3926 207th Place SE
- 3933 208th Place SE
- 20730 42nd Ave SE
- 20805 40th Dr SE
- 20701 40th Dr SE
- 3922 207th Place SE
- 3927 207th Place SE
- 4109 208th Place SE Unit 402
- 4109 208th Place SE Unit 401
- 3929 208th Place SE
- 4117 208th Place SE Unit 302
- 4117 208th Place SE Unit 301
- 3930 208th Place SE
- 20812 42nd Ave SE
- 3923 207th Place SE
- 4103 208th Place SE Unit 501
Your Personal Tour Guide
Ask me questions while you tour the home.