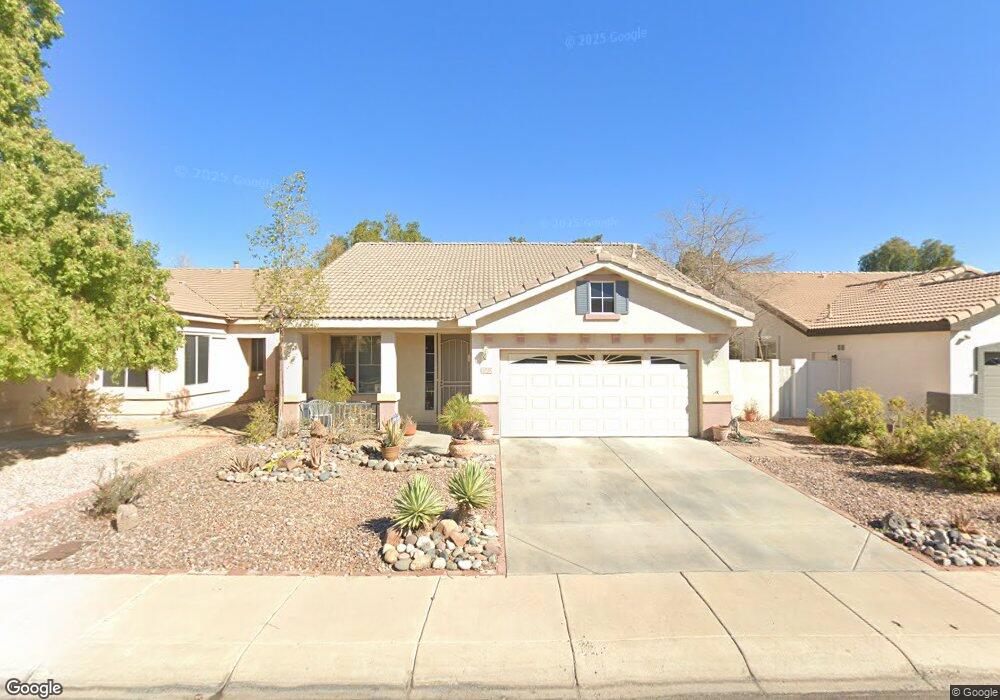
20715 N 68th Dr Glendale, AZ 85308
Arrowhead NeighborhoodEstimated Value: $491,000 - $519,000
3
Beds
2
Baths
1,633
Sq Ft
$306/Sq Ft
Est. Value
About This Home
This home is located at 20715 N 68th Dr, Glendale, AZ 85308 and is currently estimated at $500,409, approximately $306 per square foot. 20715 N 68th Dr is a home located in Maricopa County with nearby schools including Sierra Verde Elementary School, Mountain Ridge High School, and Sunrise Montessori School - North Campus.
Ownership History
Date
Name
Owned For
Owner Type
Purchase Details
Closed on
Sep 13, 2022
Sold by
Lyle Johnson H and Lyle Debra A
Bought by
Harold Lyle And Debra Ann Johnson Revocable T
Current Estimated Value
Purchase Details
Closed on
Apr 12, 2001
Sold by
Galbraith Warren M and Galbraith Joanna C
Bought by
Johnson H Lyle and Johnson Debra A
Purchase Details
Closed on
Aug 3, 1999
Sold by
Fulton Homes Sales Corp
Bought by
Galbraith Warren M and Galbraith Joanna C
Home Financials for this Owner
Home Financials are based on the most recent Mortgage that was taken out on this home.
Original Mortgage
$146,850
Interest Rate
7.37%
Mortgage Type
New Conventional
Create a Home Valuation Report for This Property
The Home Valuation Report is an in-depth analysis detailing your home's value as well as a comparison with similar homes in the area
Home Values in the Area
Average Home Value in this Area
Purchase History
| Date | Buyer | Sale Price | Title Company |
|---|---|---|---|
| Harold Lyle And Debra Ann Johnson Revocable T | -- | -- | |
| Johnson H Lyle | $158,000 | Security Title Agency | |
| Galbraith Warren M | $147,970 | Security Title Agency | |
| Fulton Homes Sales Corp | $110,853 | Security Title Agency |
Source: Public Records
Mortgage History
| Date | Status | Borrower | Loan Amount |
|---|---|---|---|
| Previous Owner | Galbraith Warren M | $146,850 |
Source: Public Records
Tax History
| Year | Tax Paid | Tax Assessment Tax Assessment Total Assessment is a certain percentage of the fair market value that is determined by local assessors to be the total taxable value of land and additions on the property. | Land | Improvement |
|---|---|---|---|---|
| 2025 | $1,992 | $24,680 | -- | -- |
| 2024 | $1,969 | $23,505 | -- | -- |
| 2023 | $1,969 | $37,180 | $7,430 | $29,750 |
| 2022 | $1,917 | $28,420 | $5,680 | $22,740 |
| 2021 | $2,021 | $24,900 | $4,980 | $19,920 |
| 2020 | $1,998 | $23,110 | $4,620 | $18,490 |
| 2019 | $1,949 | $21,730 | $4,340 | $17,390 |
| 2018 | $1,900 | $20,500 | $4,100 | $16,400 |
| 2017 | $1,849 | $18,970 | $3,790 | $15,180 |
| 2016 | $1,741 | $18,520 | $3,700 | $14,820 |
| 2015 | $1,626 | $18,330 | $3,660 | $14,670 |
Source: Public Records
Map
Nearby Homes
- 20709 N 69th Dr
- 6881 W Pontiac Dr
- 6962 W Irma Ln
- 6971 W Irma Ln
- 6832 W Sonnet Dr
- 6782 W Skylark Dr
- 6811 W Monona Dr
- 6799 W Monona Dr
- 6751 W Monona Dr
- 6754 W Monona Dr
- 20932 N 67th Dr
- 6974 W Rose Garden Ln
- 6387 W Pontiac Dr
- 21030 N 66th Ln
- 6991 W Firebird Dr
- 7101 W Beardsley Rd Unit 451
- 7101 W Beardsley Rd Unit 1303
- 7101 W Beardsley Rd Unit 1403
- 7101 W Beardsley Rd Unit 1104
- 20225 N 71st Ln
- 20711 N 68th Dr
- 20719 N 68th Dr
- 20723 N 68th Dr
- 20707 N 68th Dr
- 6856 W Irma Ln
- 6769 W Irma Ln
- 6855 W Potter Dr
- 20727 N 68th Dr
- 6860 W Irma Ln
- 20703 N 68th Dr
- 6859 W Potter Dr
- 20703 N Dr
- 6853 W Irma Ln
- 6864 W Irma Ln
- 20731 N 68th Dr
- 6857 W Irma Ln
- 6863 W Potter Dr
- 6854 W Potter Dr
- 6861 W Irma Ln
- 6868 W Irma Ln
Your Personal Tour Guide
Ask me questions while you tour the home.