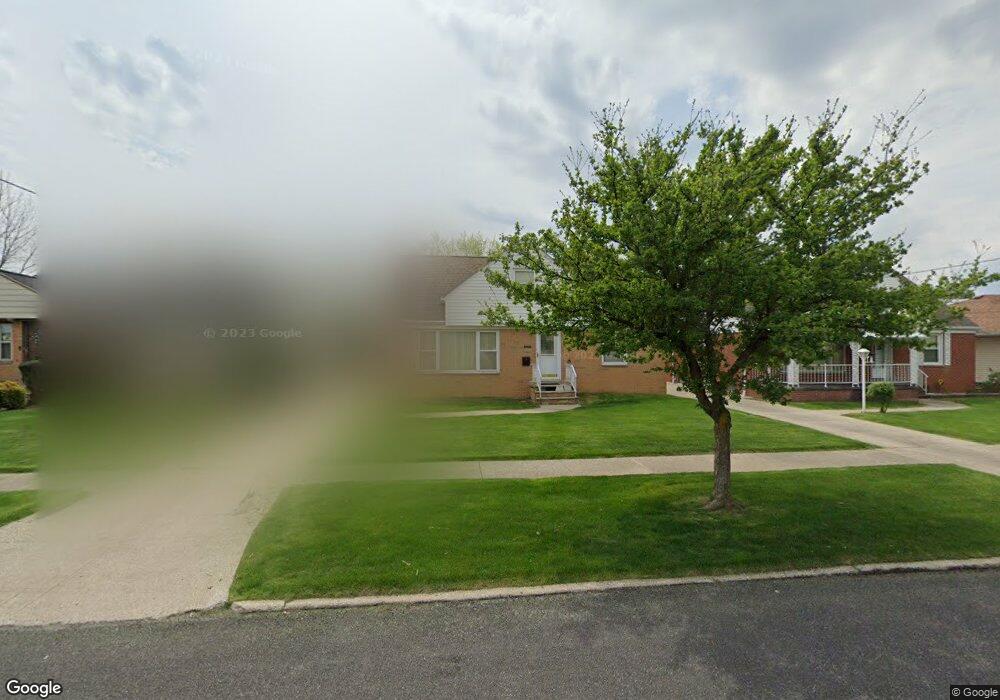
20716 Donny Brook Rd Maple Heights, OH 44137
Estimated Value: $139,000 - $178,000
3
Beds
1
Bath
1,574
Sq Ft
$96/Sq Ft
Est. Value
About This Home
This home is located at 20716 Donny Brook Rd, Maple Heights, OH 44137 and is currently estimated at $151,019, approximately $95 per square foot. 20716 Donny Brook Rd is a home located in Cuyahoga County with nearby schools including Abraham Lincoln Elementary School, Rockside/ J.F. Kennedy School, and Barack Obama School.
Ownership History
Date
Name
Owned For
Owner Type
Purchase Details
Closed on
Dec 12, 2002
Sold by
Green Michael R and Green Tracina L
Bought by
Ward Mary J
Current Estimated Value
Home Financials for this Owner
Home Financials are based on the most recent Mortgage that was taken out on this home.
Original Mortgage
$116,800
Outstanding Balance
$50,207
Interest Rate
6.25%
Estimated Equity
$100,812
Purchase Details
Closed on
Aug 1, 1996
Sold by
Ingoglia Philip J
Bought by
Green Michael R and Green Tracina L
Home Financials for this Owner
Home Financials are based on the most recent Mortgage that was taken out on this home.
Original Mortgage
$84,714
Interest Rate
8.33%
Mortgage Type
FHA
Purchase Details
Closed on
Oct 22, 1986
Sold by
Calabro Louis V
Bought by
Ingoglia Elizabeth T
Purchase Details
Closed on
Aug 20, 1985
Sold by
Calabro John and Calabro Nancy
Bought by
Calabro Louis
Purchase Details
Closed on
Jan 1, 1975
Bought by
Calabro John and Calabro Nancy
Create a Home Valuation Report for This Property
The Home Valuation Report is an in-depth analysis detailing your home's value as well as a comparison with similar homes in the area
Home Values in the Area
Average Home Value in this Area
Purchase History
| Date | Buyer | Sale Price | Title Company |
|---|---|---|---|
| Ward Mary J | $123,000 | Title Xperts Agency Inc | |
| Green Michael R | $85,000 | -- | |
| Ingoglia Elizabeth T | $36,700 | -- | |
| Ingoglia Elizabeth T | $18,400 | -- | |
| Calabro Louis | -- | -- | |
| Calabro John | -- | -- |
Source: Public Records
Mortgage History
| Date | Status | Borrower | Loan Amount |
|---|---|---|---|
| Open | Ward Mary J | $116,800 | |
| Previous Owner | Green Michael R | $84,714 |
Source: Public Records
Tax History
| Year | Tax Paid | Tax Assessment Tax Assessment Total Assessment is a certain percentage of the fair market value that is determined by local assessors to be the total taxable value of land and additions on the property. | Land | Improvement |
|---|---|---|---|---|
| 2024 | $4,034 | $45,395 | $8,680 | $36,715 |
| 2023 | $3,775 | $37,310 | $5,740 | $31,570 |
| 2022 | $3,760 | $37,310 | $5,740 | $31,570 |
| 2021 | $4,022 | $37,310 | $5,740 | $31,570 |
| 2020 | $3,404 | $28,250 | $4,340 | $23,910 |
| 2019 | $3,389 | $80,700 | $12,400 | $68,300 |
| 2018 | $3,340 | $28,250 | $4,340 | $23,910 |
| 2017 | $3,545 | $29,200 | $4,310 | $24,890 |
| 2016 | $3,428 | $29,200 | $4,310 | $24,890 |
| 2015 | $3,472 | $29,200 | $4,310 | $24,890 |
| 2014 | $3,472 | $32,070 | $4,730 | $27,340 |
Source: Public Records
Map
Nearby Homes
- 123 Willard Ave
- 54 Willard Ave
- 66 Hubbell Way
- 58 Hubbell Way
- 62 Hubbell Way
- 54 Hubbell Way
- 0 Hubbell Cir
- 61 Hubbell Way
- 57 Hubbell Way
- 339 Grand Blvd
- 419 Center Rd
- 5424 Fairtree Rd
- 19113 Watercrest Ave
- 21607 Libby Rd
- 21202 Gardenview Dr
- 20806 Clare Ave
- 109 Avalon Dr
- 541 Helper Dr
- 21202 Hillgrove Ave
- 21860 Louis Rd
- 20720 Donny Brook Rd
- 20712 Donny Brook Rd
- 20724 Donny Brook Rd
- 20708 Donny Brook Rd
- 20728 Donny Brook Rd
- 20704 Donny Brook Rd
- 20732 Donny Brook Rd
- 20700 Donny Brook Rd
- 5569 Sunnyslope Rd
- 5573 Sunnyslope Rd
- 20715 Donny Brook Rd
- 20711 Donny Brook Rd
- 20719 Donny Brook Rd
- 20736 Donny Brook Rd
- 20707 Donny Brook Rd
- 20696 Donny Brook Rd
- 20723 Donny Brook Rd
- 20703 Donny Brook Rd
- 20731 Donnybrook Rd
- 20727 Donny Brook Rd
Your Personal Tour Guide
Ask me questions while you tour the home.