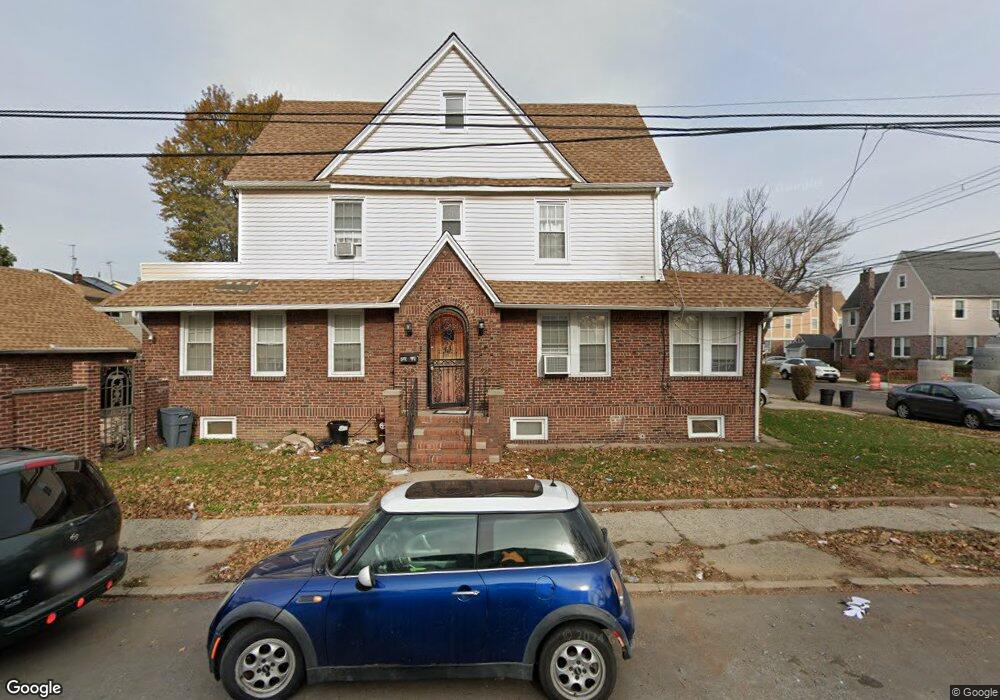
20719 111th Ave Queens Village, NY 11429
Queens Village NeighborhoodEstimated Value: $886,304 - $971,000
8
Beds
4
Baths
2,016
Sq Ft
$460/Sq Ft
Est. Value
About This Home
This home is located at 20719 111th Ave, Queens Village, NY 11429 and is currently estimated at $928,076, approximately $460 per square foot. 20719 111th Ave is a home located in Queens County with nearby schools including P.S. 134 Langston Hughes School, I.S. 192 The Linden, and Ss Joachim & Anne School.
Ownership History
Date
Name
Owned For
Owner Type
Purchase Details
Closed on
Mar 25, 2014
Sold by
Nyc Holding Group Llc
Bought by
St Fleur Pascale
Current Estimated Value
Home Financials for this Owner
Home Financials are based on the most recent Mortgage that was taken out on this home.
Original Mortgage
$436,939
Outstanding Balance
$331,058
Interest Rate
4.33%
Mortgage Type
New Conventional
Estimated Equity
$597,018
Purchase Details
Closed on
Jul 17, 2013
Sold by
Estate Of Carolyn G Lipscomb and Estate Of Freeman Lipscomb Jr
Bought by
Nyc Holding Group Llc
Home Financials for this Owner
Home Financials are based on the most recent Mortgage that was taken out on this home.
Original Mortgage
$270,000
Interest Rate
4.51%
Mortgage Type
Commercial
Purchase Details
Closed on
Dec 20, 1996
Sold by
Lipscomb Freeman
Bought by
Lipscomb Freeman and Lipscomb Carolyn
Purchase Details
Closed on
Jul 11, 1996
Sold by
Lipscomb Freeman and Lipscomb Richard
Bought by
Lipscomb Freeman
Create a Home Valuation Report for This Property
The Home Valuation Report is an in-depth analysis detailing your home's value as well as a comparison with similar homes in the area
Home Values in the Area
Average Home Value in this Area
Purchase History
| Date | Buyer | Sale Price | Title Company |
|---|---|---|---|
| St Fleur Pascale | $445,000 | -- | |
| St Fleur Pascale | $445,000 | -- | |
| Nyc Holding Group Llc | $270,000 | -- | |
| Nyc Holding Group Llc | $270,000 | -- | |
| Lipscomb Freeman | -- | -- | |
| Lipscomb Freeman | -- | -- | |
| Lipscomb Freeman | $100,000 | -- | |
| Lipscomb Freeman | -- | -- |
Source: Public Records
Mortgage History
| Date | Status | Borrower | Loan Amount |
|---|---|---|---|
| Open | St Fleur Pascale | $436,939 | |
| Closed | St Fleur Pascale | $436,939 | |
| Previous Owner | Nyc Holding Group Llc | $270,000 |
Source: Public Records
Tax History Compared to Growth
Tax History
| Year | Tax Paid | Tax Assessment Tax Assessment Total Assessment is a certain percentage of the fair market value that is determined by local assessors to be the total taxable value of land and additions on the property. | Land | Improvement |
|---|---|---|---|---|
| 2025 | $6,865 | $36,115 | $9,841 | $26,274 |
| 2024 | $6,865 | $34,180 | $9,161 | $25,019 |
| 2023 | $6,477 | $32,246 | $9,031 | $23,215 |
| 2022 | $6,437 | $37,920 | $12,720 | $25,200 |
| 2021 | $6,409 | $40,560 | $12,720 | $27,840 |
| 2020 | $6,370 | $36,660 | $12,720 | $23,940 |
| 2019 | $5,958 | $35,700 | $12,720 | $22,980 |
| 2018 | $5,478 | $26,872 | $12,095 | $14,777 |
| 2017 | $5,478 | $26,872 | $10,893 | $15,979 |
| 2016 | $5,074 | $26,872 | $10,893 | $15,979 |
| 2015 | $3,058 | $25,080 | $14,100 | $10,980 |
| 2014 | $3,058 | $23,736 | $13,344 | $10,392 |
Source: Public Records
Map
Nearby Homes
- 11044 208th St
- 109-87 Francis Lewis Blvd
- 110-22 207th St
- 112-09 Francis Lewis Blvd
- 110-06 209th Place
- 205-28 110th Ave
- 111-09 205th St
- 11210 Colfax St
- 111-39 205th St
- 209-30 111th Rd
- 113-06 208th St
- 10925 208th St
- 11243 Colfax St
- 109-12 Francis Lewis Blvd
- 11119 212th St
- 112-32 204th St
- 112-38 212th St
- 10967 203rd St
- 109-28 212th St
- 11028 213th St
- 207-19 111th Ave
- 20719 111th Ave
- 11050 208th St
- 11048 208th St
- 20718 111th Ave
- 11053 207th St
- 11051 207th St
- 11104 208th St
- 110-49 207th St
- 11049 207th St
- 11047 208th St
- 110-42 208th St
- 111-03 208th St
- 11042 208th St
- 11047 207th St
- 20704 111th Ave
- 111-08 208th St
- 11108 208th St
- 207 W 111th St
- 11043 207th St