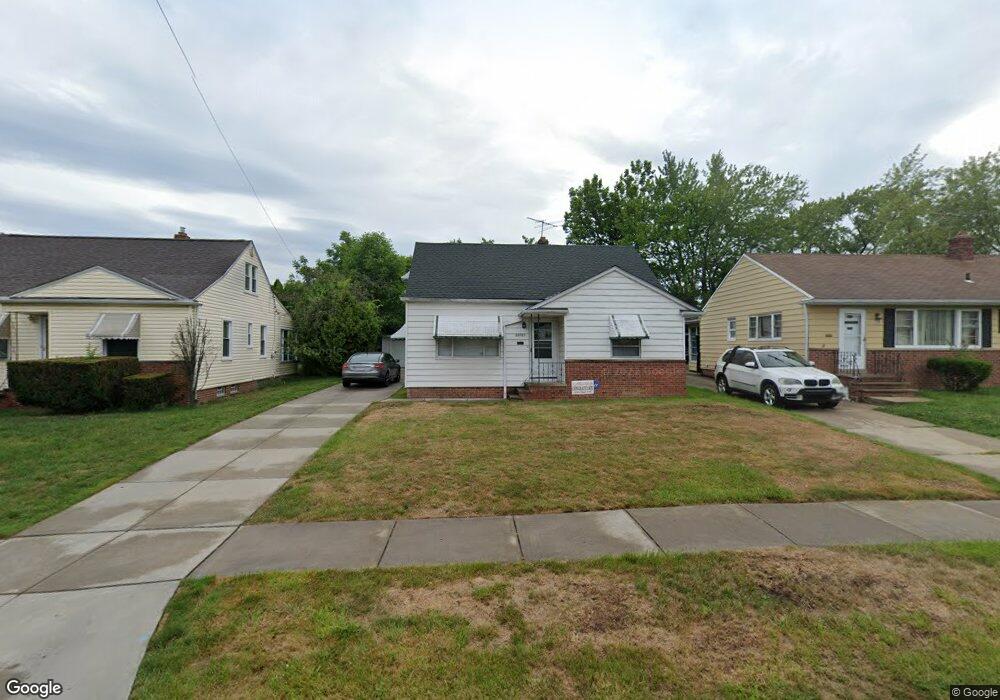
20723 Applegate Rd Maple Heights, OH 44137
Estimated Value: $124,000 - $138,000
3
Beds
1
Bath
1,228
Sq Ft
$105/Sq Ft
Est. Value
About This Home
This home is located at 20723 Applegate Rd, Maple Heights, OH 44137 and is currently estimated at $128,642, approximately $104 per square foot. 20723 Applegate Rd is a home located in Cuyahoga County with nearby schools including Abraham Lincoln Elementary School, Rockside/ J.F. Kennedy School, and Barack Obama School.
Ownership History
Date
Name
Owned For
Owner Type
Purchase Details
Closed on
Apr 18, 2013
Sold by
Sibbison Wanona and Sibbison Wanona Isaac
Bought by
Sibbison Richard and Sibbison Richard D
Current Estimated Value
Purchase Details
Closed on
Sep 12, 2008
Sold by
Bank Of New York
Bought by
Sibbison Richard
Purchase Details
Closed on
Jul 20, 2007
Sold by
Jefferson Carmelene R
Bought by
Bank Of New York
Purchase Details
Closed on
Jan 20, 1993
Sold by
Kraska Stanley J
Bought by
Jefferson Carmelene R
Purchase Details
Closed on
Sep 10, 1992
Sold by
Kraska Stanley J
Bought by
Kraska Stanley J
Purchase Details
Closed on
Nov 9, 1983
Sold by
Kraska Stanley J and Kraska Genevieve
Bought by
Kraska Stanley J
Purchase Details
Closed on
Jan 1, 1975
Bought by
Kraska Stanley J and Kraska Genevieve
Create a Home Valuation Report for This Property
The Home Valuation Report is an in-depth analysis detailing your home's value as well as a comparison with similar homes in the area
Home Values in the Area
Average Home Value in this Area
Purchase History
| Date | Buyer | Sale Price | Title Company |
|---|---|---|---|
| Sibbison Richard | -- | Attorney | |
| Sibbison Richard | $19,425 | Thoroughbred Title | |
| Bank Of New York | $46,667 | Attorney | |
| Jefferson Carmelene R | $63,900 | -- | |
| Kraska Stanley J | -- | -- | |
| Kraska Stanley J | -- | -- | |
| Kraska Stanley J | -- | -- |
Source: Public Records
Tax History
| Year | Tax Paid | Tax Assessment Tax Assessment Total Assessment is a certain percentage of the fair market value that is determined by local assessors to be the total taxable value of land and additions on the property. | Land | Improvement |
|---|---|---|---|---|
| 2024 | $3,671 | $39,900 | $7,245 | $32,655 |
| 2023 | $2,293 | $20,450 | $4,800 | $15,650 |
| 2022 | $2,285 | $20,440 | $4,800 | $15,650 |
| 2021 | $2,433 | $20,440 | $4,800 | $15,650 |
| 2020 | $2,088 | $15,510 | $3,640 | $11,870 |
| 2019 | $2,075 | $55,300 | $10,400 | $44,900 |
| 2018 | $2,482 | $19,360 | $3,640 | $15,720 |
| 2017 | $1,442 | $9,560 | $3,610 | $5,950 |
| 2016 | $1,393 | $9,560 | $3,610 | $5,950 |
| 2015 | -- | $9,560 | $3,610 | $5,950 |
| 2014 | -- | $10,510 | $3,960 | $6,550 |
Source: Public Records
Map
Nearby Homes
- 21202 Gardenview Dr
- 21607 Libby Rd
- 123 Willard Ave
- 339 Grand Blvd
- 19113 Watercrest Ave
- 54 Willard Ave
- 5424 Fairtree Rd
- 20806 Clare Ave
- 66 Hubbell Way
- 58 Hubbell Way
- 62 Hubbell Way
- 54 Hubbell Way
- 0 Hubbell Cir
- 419 Center Rd
- 61 Hubbell Way
- 57 Hubbell Way
- 21202 Hillgrove Ave
- 21860 Louis Rd
- 19289 Stafford Ave
- 21600 Franklin Rd
- 20727 Applegate Rd
- 20719 Applegate Rd
- 20731 Applegate Rd
- 20715 Applegate Rd
- 20730 Bowling Green Rd
- 20726 Bowling Green Rd
- 20722 Bowling Green Rd
- 20734 Bowling Green Rd
- 20735 Applegate Rd
- 20711 Applegate Rd
- 20720 Applegate Rd
- 20738 Bowling Green Rd
- 20718 Bowling Green Rd
- 20724 Applegate Rd
- 20728 Applegate Rd
- 20716 Applegate Rd
- 20714 Bowling Green Rd
- 20707 Applegate Rd
- 20742 Bowling Green Rd
- 20732 Applegate Rd
Your Personal Tour Guide
Ask me questions while you tour the home.