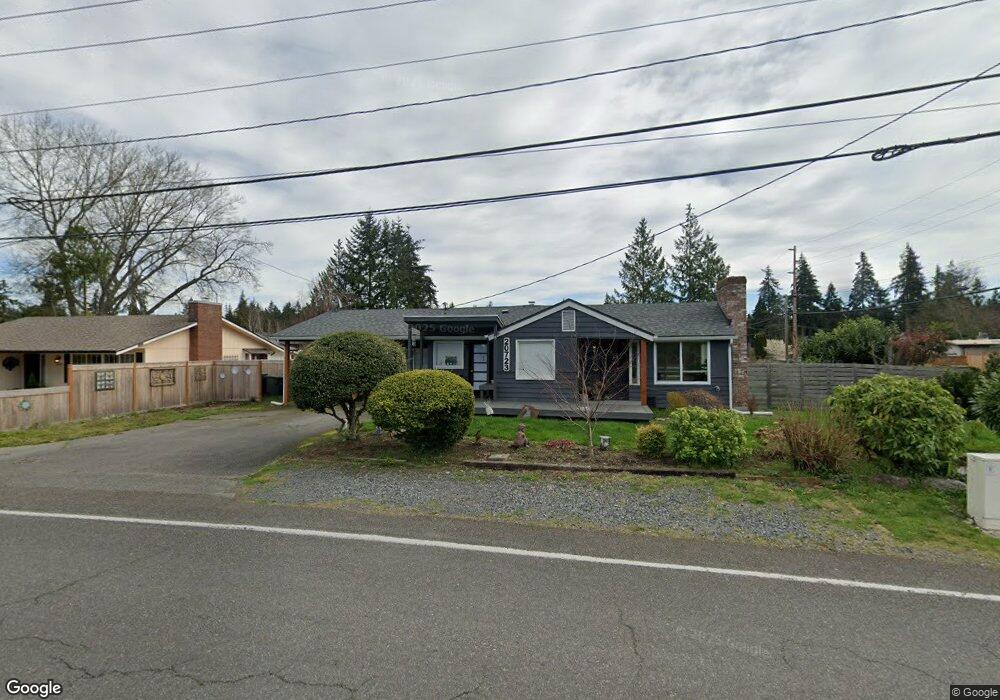
20723 Maplewood Dr Edmonds, WA 98026
Edmonds Bowl NeighborhoodEstimated Value: $770,000 - $995,000
3
Beds
2
Baths
2,032
Sq Ft
$447/Sq Ft
Est. Value
About This Home
This home is located at 20723 Maplewood Dr, Edmonds, WA 98026 and is currently estimated at $908,434, approximately $447 per square foot. 20723 Maplewood Dr is a home located in Snohomish County with nearby schools including Edmonds Elementary School, Meadowdale Middle School, and Meadowdale High School.
Ownership History
Date
Name
Owned For
Owner Type
Purchase Details
Closed on
Oct 14, 2020
Sold by
Hammer Laurel A
Bought by
Hammer Laurel A and Miller Kay F
Current Estimated Value
Home Financials for this Owner
Home Financials are based on the most recent Mortgage that was taken out on this home.
Original Mortgage
$184,000
Outstanding Balance
$163,360
Interest Rate
2.8%
Mortgage Type
New Conventional
Estimated Equity
$745,074
Purchase Details
Closed on
May 19, 1997
Sold by
Nishimoto Katsu and Nishimoto Maria Lourdes
Bought by
Hammer Frank Jay and Hammer Laurel A
Home Financials for this Owner
Home Financials are based on the most recent Mortgage that was taken out on this home.
Original Mortgage
$112,000
Interest Rate
8.5%
Purchase Details
Closed on
Sep 10, 1994
Sold by
Nishimoto Katsu and Nishimoto Maria Lourdes
Bought by
Graham Sherman Dean and Graham Rosalie A
Home Financials for this Owner
Home Financials are based on the most recent Mortgage that was taken out on this home.
Original Mortgage
$125,000
Interest Rate
8.37%
Mortgage Type
Seller Take Back
Create a Home Valuation Report for This Property
The Home Valuation Report is an in-depth analysis detailing your home's value as well as a comparison with similar homes in the area
Home Values in the Area
Average Home Value in this Area
Purchase History
| Date | Buyer | Sale Price | Title Company |
|---|---|---|---|
| Hammer Laurel A | -- | Ticor Title | |
| Hammer Frank J | -- | Ticor Title | |
| Hammer Frank Jay | $160,000 | Fidelity National Title | |
| Graham Sherman Dean | $155,000 | Western Title Co |
Source: Public Records
Mortgage History
| Date | Status | Borrower | Loan Amount |
|---|---|---|---|
| Open | Hammer Laurel A | $184,000 | |
| Closed | Hammer Frank Jay | $112,000 | |
| Previous Owner | Graham Sherman Dean | $125,000 |
Source: Public Records
Tax History
| Year | Tax Paid | Tax Assessment Tax Assessment Total Assessment is a certain percentage of the fair market value that is determined by local assessors to be the total taxable value of land and additions on the property. | Land | Improvement |
|---|---|---|---|---|
| 2025 | $4,780 | $736,500 | $641,600 | $94,900 |
| 2024 | $4,780 | $677,000 | $582,100 | $94,900 |
| 2023 | $4,782 | $701,800 | $604,200 | $97,600 |
| 2022 | $4,712 | $568,800 | $495,100 | $73,700 |
| 2020 | $4,388 | $472,200 | $387,900 | $84,300 |
| 2019 | $3,903 | $423,300 | $340,500 | $82,800 |
| 2018 | $4,125 | $386,500 | $312,600 | $73,900 |
| 2017 | $3,473 | $340,900 | $279,900 | $61,000 |
| 2016 | $3,183 | $309,800 | $251,200 | $58,600 |
Source: Public Records
Map
Nearby Homes
- 8732 209th Place SW
- 1133 Emerald Hills Dr
- 8515 Main St Unit 103
- 8500 Main St Unit F212
- 8500 Main St Unit F305
- 21318 Pioneer Way
- 9533 Bowdoin Way
- 1021 Walnut St
- 8225 212th St SW Unit 302
- 21224 82nd Place W
- 8427 200th St SW
- 8504 199th Place SW
- 21505 84th Ave W
- 8523 199th Place SW
- 8004 203rd Place SW
- 9004 218th St SW
- 7924 212th St SW Unit 305
- 7924 212th St SW Unit 104
- 910 9th Ave N
- 816 Walnut St
- 20725 Maplewood Dr
- 8917 Main St
- 9018 Main St
- 20709 Maplewood Dr
- 20802 Hillcrest Place
- 9110 207th Place SW
- 8816 207th Place SW
- 8831 Main St
- 20815 Hillcrest Place
- 8928 Main St
- 8814 207th Place SW
- 20710 Maplewood Dr
- 8830 Main St
- 8821 Main St
- 9118 Main St
- 8812 207th Place SW
- 9114 207th Place SW
- 20821 Hillcrest Place
- 20820 Hillcrest Place
- 20708 Maplewood Dr
Your Personal Tour Guide
Ask me questions while you tour the home.