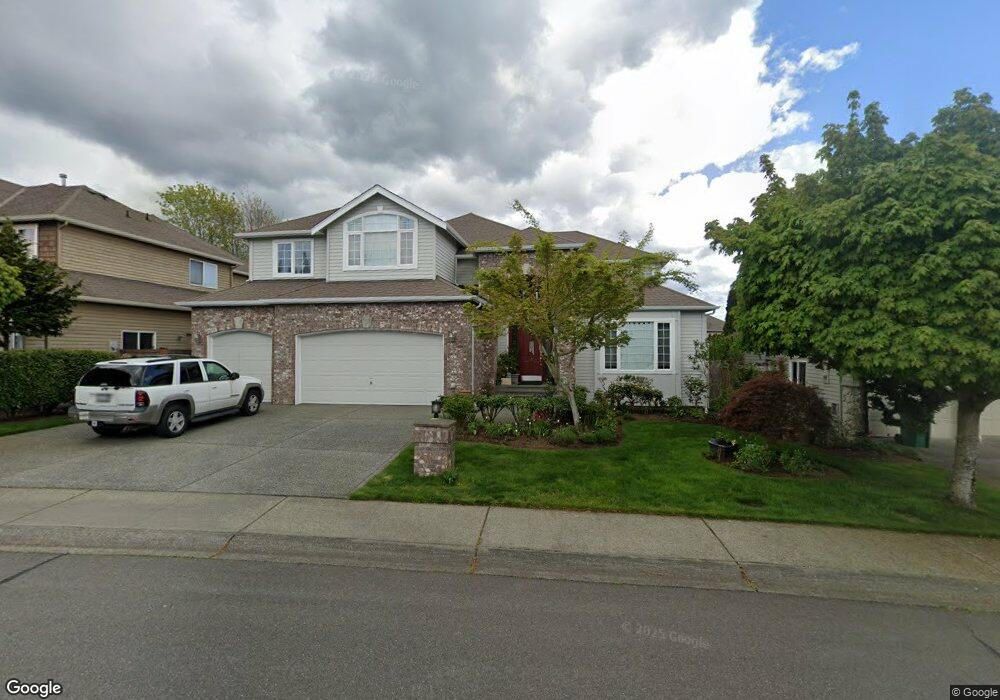
20727 37th Ave SE Bothell, WA 98021
Canyon Creek NeighborhoodEstimated Value: $1,453,000 - $1,866,000
4
Beds
3
Baths
3,501
Sq Ft
$468/Sq Ft
Est. Value
About This Home
This home is located at 20727 37th Ave SE, Bothell, WA 98021 and is currently estimated at $1,636,964, approximately $467 per square foot. 20727 37th Ave SE is a home located in Snohomish County with nearby schools including Canyon Creek Elementary School, Skyview Middle School, and North Creek High School.
Ownership History
Date
Name
Owned For
Owner Type
Purchase Details
Closed on
May 8, 2006
Sold by
Lee Jung Eun
Bought by
Chu John B and Wong Lying S
Current Estimated Value
Purchase Details
Closed on
Mar 17, 2006
Sold by
Lee Min K
Bought by
Shin Jung Eun and Lee Jung Eun
Purchase Details
Closed on
Jul 17, 2003
Sold by
Lee Min
Bought by
Lee Jung Eun
Home Financials for this Owner
Home Financials are based on the most recent Mortgage that was taken out on this home.
Original Mortgage
$415,992
Interest Rate
6.9%
Mortgage Type
Purchase Money Mortgage
Purchase Details
Closed on
Jul 16, 2003
Sold by
Evergreen Highlands Inc
Bought by
Lee Jung Eun
Home Financials for this Owner
Home Financials are based on the most recent Mortgage that was taken out on this home.
Original Mortgage
$415,992
Interest Rate
6.9%
Mortgage Type
Purchase Money Mortgage
Create a Home Valuation Report for This Property
The Home Valuation Report is an in-depth analysis detailing your home's value as well as a comparison with similar homes in the area
Home Values in the Area
Average Home Value in this Area
Purchase History
| Date | Buyer | Sale Price | Title Company |
|---|---|---|---|
| Chu John B | $635,000 | Rainier Title | |
| Shin Jung Eun | -- | None Available | |
| Lee Jung Eun | -- | Chicago Title Insurance Co | |
| Lee Jung Eun | $519,990 | Chicago Title Insurance Co |
Source: Public Records
Mortgage History
| Date | Status | Borrower | Loan Amount |
|---|---|---|---|
| Previous Owner | Lee Jung Eun | $415,992 |
Source: Public Records
Tax History
| Year | Tax Paid | Tax Assessment Tax Assessment Total Assessment is a certain percentage of the fair market value that is determined by local assessors to be the total taxable value of land and additions on the property. | Land | Improvement |
|---|---|---|---|---|
| 2026 | $12,226 | $1,519,500 | $870,000 | $649,500 |
| 2025 | $10,780 | $1,369,200 | $745,000 | $624,200 |
| 2024 | $10,780 | $1,206,700 | $651,000 | $555,700 |
| 2023 | $11,116 | $1,387,600 | $755,000 | $632,600 |
| 2022 | $10,208 | $1,013,400 | $470,000 | $543,400 |
| 2020 | $9,582 | $897,900 | $420,000 | $477,900 |
| 2019 | $8,278 | $784,200 | $335,000 | $449,200 |
| 2018 | $7,878 | $695,100 | $290,000 | $405,100 |
| 2017 | $6,858 | $615,900 | $235,000 | $380,900 |
| 2016 | $7,304 | $641,500 | $215,000 | $426,500 |
| 2015 | $7,182 | $599,300 | $200,000 | $399,300 |
| 2013 | $6,124 | $454,400 | $145,800 | $308,600 |
Source: Public Records
Map
Nearby Homes
- 3323 207th Place SE
- 20500 32nd Dr SE
- 3618 202nd St SE
- 3422 201st Place SE
- 20501 31st Dr SE
- 20911 30th Dr SE
- 3918 214th Place SE Unit A
- 3912 199th Place SE
- 3928 214th Place SE Unit B
- 4001 215th St SE Unit A
- 3908 199th SE
- 3924 190th Place SE
- 3916 199th Place SE
- 4010 199th Place SE
- 19911 34th Dr SE
- 4014 199th Place SE
- 19923 40th Dr SE
- 4005 199th Place SE
- 4013 199th Place SE
- 4009 199th Place SE
- 20731 37th Ave SE
- 20717 37th Ave SE
- 20807 37th Ave SE
- 20722 37th Dr SE
- 20726 37th Dr SE
- 20709 37th Ave SE
- 3712 207th Place SE
- 20730 37th Dr SE
- 20730 37th Dr SE Unit 13
- 3708 207th Place SE
- 20813 37th Ave SE
- 20716 37th Ave SE
- 20728 37th Dr SE
- 3716 207th Place SE
- 20812 37th Ave SE
- 20703 37th Ave SE
- 20802 37th Dr SE
- 3625 208th St SE
- 20706 37th Ave SE
- 3711 207th Place SE
Your Personal Tour Guide
Ask me questions while you tour the home.