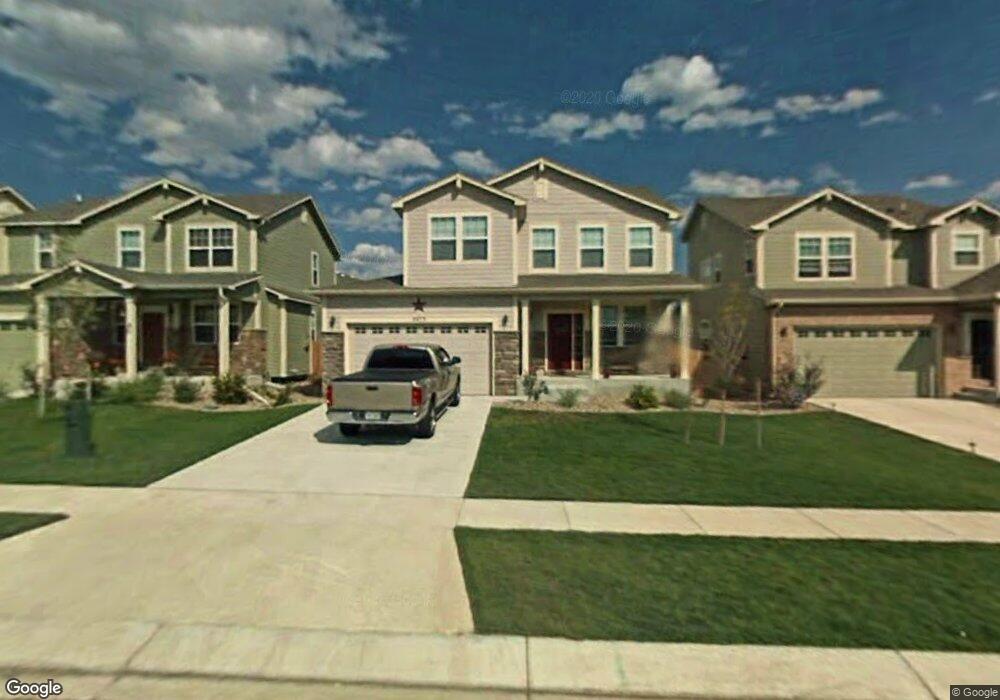
2073 Capital Dr Colorado Springs, CO 80951
Estimated Value: $427,000 - $472,000
4
Beds
3
Baths
2,603
Sq Ft
$172/Sq Ft
Est. Value
About This Home
This home is located at 2073 Capital Dr, Colorado Springs, CO 80951 and is currently estimated at $447,272, approximately $171 per square foot. 2073 Capital Dr is a home located in El Paso County with nearby schools including Evans International Elementary School, Coldwater Canyon Elementary, and Clover Avenue Elementary School.
Ownership History
Date
Name
Owned For
Owner Type
Purchase Details
Closed on
Jun 3, 2019
Sold by
Ho Ching Charles Ho and Ho Ching Siopea Fetu
Bought by
Ho Ching Charles Tanaluga Ho and Ho Ching Siopea Fetu
Current Estimated Value
Home Financials for this Owner
Home Financials are based on the most recent Mortgage that was taken out on this home.
Original Mortgage
$305,118
Outstanding Balance
$268,812
Interest Rate
4.2%
Mortgage Type
VA
Estimated Equity
$178,460
Purchase Details
Closed on
Apr 11, 2016
Sold by
Richmond Andrew Pierce and Richmond Jennifer
Bought by
Ching Charles Ho and Ching Siopea Fetu Ho
Home Financials for this Owner
Home Financials are based on the most recent Mortgage that was taken out on this home.
Original Mortgage
$250,267
Interest Rate
3.64%
Mortgage Type
VA
Purchase Details
Closed on
Jul 18, 2014
Sold by
Repola Alexander Paul and Repola Erin Mae
Bought by
Richmond Andrew Pierce and Richmond Jennifer
Home Financials for this Owner
Home Financials are based on the most recent Mortgage that was taken out on this home.
Original Mortgage
$227,794
Interest Rate
4.17%
Mortgage Type
VA
Purchase Details
Closed on
Jul 26, 2012
Sold by
Erickson Mary A and Zid Robert W
Bought by
Repola Alexander Paul and Repola Erin Mae
Home Financials for this Owner
Home Financials are based on the most recent Mortgage that was taken out on this home.
Original Mortgage
$206,196
Interest Rate
3.5%
Mortgage Type
FHA
Purchase Details
Closed on
Aug 31, 2009
Sold by
Palm Thomas and Purling Natalie
Bought by
Erickson Mary A and Zid Robert W
Home Financials for this Owner
Home Financials are based on the most recent Mortgage that was taken out on this home.
Original Mortgage
$145,000
Interest Rate
5.16%
Mortgage Type
New Conventional
Purchase Details
Closed on
May 10, 2007
Sold by
The Bank Of New York
Bought by
Purling Natalie and Palm Thomas
Home Financials for this Owner
Home Financials are based on the most recent Mortgage that was taken out on this home.
Original Mortgage
$215,000
Interest Rate
7.25%
Mortgage Type
Unknown
Purchase Details
Closed on
Oct 28, 2005
Sold by
Beazer Homes Holdings Corp
Bought by
Mudery Brian T
Home Financials for this Owner
Home Financials are based on the most recent Mortgage that was taken out on this home.
Original Mortgage
$186,100
Interest Rate
6.25%
Mortgage Type
Fannie Mae Freddie Mac
Create a Home Valuation Report for This Property
The Home Valuation Report is an in-depth analysis detailing your home's value as well as a comparison with similar homes in the area
Home Values in the Area
Average Home Value in this Area
Purchase History
| Date | Buyer | Sale Price | Title Company |
|---|---|---|---|
| Ho Ching Charles Tanaluga Ho | -- | Empire Title Co Springs Llc | |
| Ching Charles Ho | $245,000 | Empire Title Of Co Springs | |
| Richmond Andrew Pierce | $223,000 | Unified Title Company | |
| Repola Alexander Paul | $210,000 | None Available | |
| Erickson Mary A | $195,000 | Land Title Guarantee Company | |
| Purling Natalie | $215,000 | Servicelink Lp | |
| Mudery Brian T | $232,637 | Land Title Guarantee Company |
Source: Public Records
Mortgage History
| Date | Status | Borrower | Loan Amount |
|---|---|---|---|
| Open | Ho Ching Charles Tanaluga Ho | $305,118 | |
| Closed | Ching Charles Ho | $250,267 | |
| Previous Owner | Richmond Andrew Pierce | $227,794 | |
| Previous Owner | Repola Alexander Paul | $206,196 | |
| Previous Owner | Erickson Mary A | $145,000 | |
| Previous Owner | Purling Natalie | $215,000 | |
| Previous Owner | Mudery Brian T | $186,100 |
Source: Public Records
Tax History Compared to Growth
Tax History
| Year | Tax Paid | Tax Assessment Tax Assessment Total Assessment is a certain percentage of the fair market value that is determined by local assessors to be the total taxable value of land and additions on the property. | Land | Improvement |
|---|---|---|---|---|
| 2025 | $2,004 | $31,400 | -- | -- |
| 2024 | $1,900 | $30,560 | $5,290 | $25,270 |
| 2023 | $1,900 | $30,560 | $5,290 | $25,270 |
| 2022 | $2,123 | $22,110 | $4,170 | $17,940 |
| 2021 | $2,203 | $22,750 | $4,290 | $18,460 |
| 2020 | $1,899 | $19,560 | $3,580 | $15,980 |
| 2019 | $1,995 | $19,560 | $3,580 | $15,980 |
| 2018 | $1,710 | $16,580 | $3,560 | $13,020 |
| 2017 | $1,612 | $16,580 | $3,560 | $13,020 |
| 2016 | $1,537 | $16,190 | $3,580 | $12,610 |
| 2015 | $1,538 | $16,190 | $3,580 | $12,610 |
| 2014 | $1,370 | $14,240 | $3,580 | $10,660 |
Source: Public Records
Map
Nearby Homes
- 1974 Capital Dr
- 1725 Bucolo Ave
- 2524 Obsidian Forest View
- 2034 Lillian Way
- 1998 Lattern Ct
- 2322 Springside Dr
- 2442 Tempest Dr
- 1925 Dewhirst Dr
- 8163 Postrock Dr
- 1768 Reilly Grove
- 2265 Sage Grouse Ln
- 8029 Sandy Ct
- 2610 Tempest Dr
- 2631 Gobi Dr
- 1898 Woodpark Dr
- 2656 Gobi Dr
- 7820 Parsonage Ln
- 2338 Jeanette Way
- 1985 Reed Grass Way
- 1874 Sandtoft Heights
- 2087 Capital Dr
- 2059 Capital Dr
- 2115 Capital Dr
- 2045 Capital Dr
- 8050 Windrow Ct
- 8030 Windrow Ct
- 8070 Windrow Ct
- 2031 Capital Dr
- 2143 Capital Dr
- 2072 Capital Dr
- 2086 Capital Dr
- 2058 Capital Dr
- 2114 Capital Dr
- 2044 Capital Dr
- 2017 Capital Dr
- 2128 Capital Dr
- 2171 Capital Dr
- 2030 Capital Dr
- 8010 Windrow Ct
- 2126 Riverwalk Pkwy