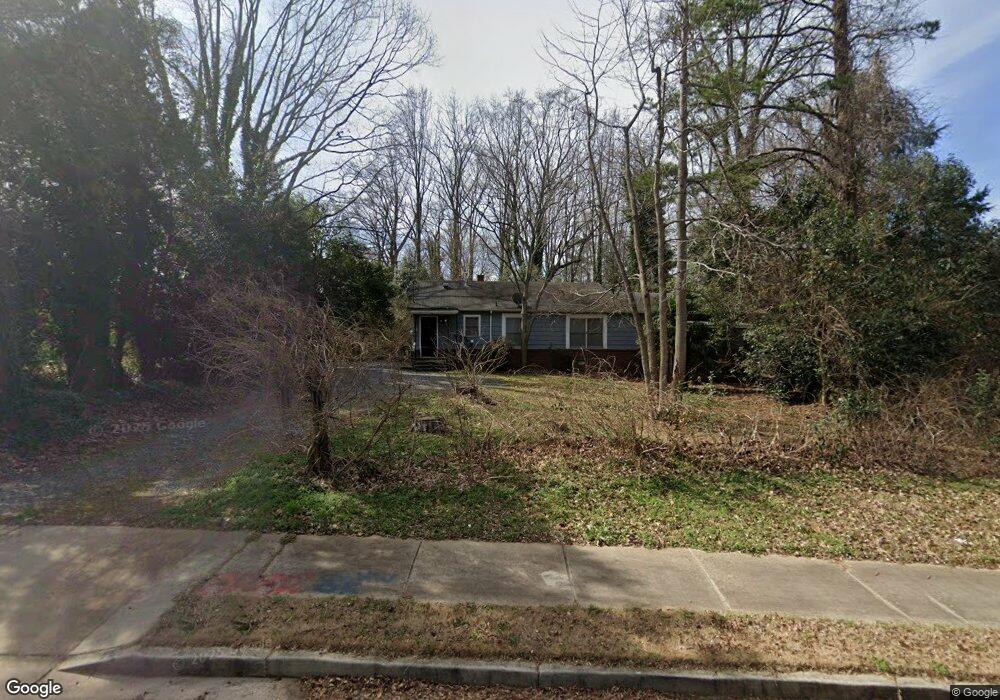
2073 Ebinport Rd Rock Hill, SC 29732
Estimated Value: $270,768 - $331,000
3
Beds
1
Bath
1,439
Sq Ft
$207/Sq Ft
Est. Value
About This Home
This home is located at 2073 Ebinport Rd, Rock Hill, SC 29732 and is currently estimated at $298,442, approximately $207 per square foot. 2073 Ebinport Rd is a home located in York County with nearby schools including Ebinport Elementary School, W.C. Sullivan Middle School, and Northwestern High School.
Ownership History
Date
Name
Owned For
Owner Type
Purchase Details
Closed on
Apr 17, 2018
Sold by
Bolyard Thomas H and Bolyard Dana E
Bought by
Bolyard Thomas R
Current Estimated Value
Purchase Details
Closed on
Jul 6, 2015
Sold by
Bolyard Brandon
Bought by
Bolyard Thomas H and Bolyard Dana E
Purchase Details
Closed on
Mar 7, 2008
Sold by
Bolyard Thomas H and Bolyard Dana E
Bought by
Bolyard Brandon
Home Financials for this Owner
Home Financials are based on the most recent Mortgage that was taken out on this home.
Original Mortgage
$82,400
Interest Rate
5.62%
Mortgage Type
New Conventional
Purchase Details
Closed on
Jul 17, 2007
Sold by
Us Bank Na
Bought by
Bolyard Thomas H and Bolyard Dana E
Purchase Details
Closed on
May 16, 2007
Sold by
Craycraft Ty R and Craycraft Kimberly J
Bought by
Us Bank Na and Pooling & Servicing Agreement With Pooli
Purchase Details
Closed on
Nov 10, 2005
Sold by
Estate Of Zenobia Broadnax Robinson
Bought by
Craycraft Ty R and Craycraft Kimberly J
Home Financials for this Owner
Home Financials are based on the most recent Mortgage that was taken out on this home.
Original Mortgage
$95,000
Interest Rate
8.5%
Mortgage Type
Adjustable Rate Mortgage/ARM
Create a Home Valuation Report for This Property
The Home Valuation Report is an in-depth analysis detailing your home's value as well as a comparison with similar homes in the area
Home Values in the Area
Average Home Value in this Area
Purchase History
| Date | Buyer | Sale Price | Title Company |
|---|---|---|---|
| Bolyard Thomas R | $80,000 | None Available | |
| Bolyard Thomas H | -- | -- | |
| Bolyard Thomas H | -- | -- | |
| Bolyard Brandon | $82,400 | None Available | |
| Bolyard Thomas H | $76,600 | None Available | |
| Us Bank Na | $2,500 | None Available | |
| Craycraft Ty R | $95,000 | -- |
Source: Public Records
Mortgage History
| Date | Status | Borrower | Loan Amount |
|---|---|---|---|
| Previous Owner | Bolyard Brandon | $82,400 | |
| Previous Owner | Craycraft Ty R | $95,000 |
Source: Public Records
Tax History
| Year | Tax Paid | Tax Assessment Tax Assessment Total Assessment is a certain percentage of the fair market value that is determined by local assessors to be the total taxable value of land and additions on the property. | Land | Improvement |
|---|---|---|---|---|
| 2025 | $2,870 | $8,159 | $2,110 | $6,049 |
| 2024 | $2,578 | $7,095 | $2,520 | $4,575 |
| 2023 | $2,603 | $7,095 | $2,520 | $4,575 |
| 2022 | $2,448 | $7,095 | $2,520 | $4,575 |
| 2021 | -- | $7,095 | $2,520 | $4,575 |
| 2020 | $2,383 | $7,095 | $0 | $0 |
| 2019 | $2,419 | $6,990 | $0 | $0 |
| 2018 | $2,086 | $6,990 | $0 | $0 |
| 2017 | $1,996 | $6,150 | $0 | $0 |
| 2016 | $1,943 | $6,150 | $0 | $0 |
| 2014 | -- | $6,150 | $2,520 | $3,630 |
| 2013 | -- | $6,360 | $2,520 | $3,840 |
Source: Public Records
Map
Nearby Homes
- 100 Warrington Place
- 800 Warrington Place
- 700 Warrington Place Unit I
- 2263 India Hook Rd
- 2129 James Ct
- 3065 Devonshire Dr
- 3708 Celanese Rd
- 3217 Celanese Rd
- 2958 Sancreek Dr
- 2733 Harlinsdale Dr
- 3154 Devonshire Dr
- 1981 Hamptonwood Rd
- 2107 Eakle Dr
- 740 Tavern Ct Unit 7
- 1705 Kallaramo Rd
- 3231 Fairhaven Rd
- 279 Plantation Rd Unit 50
- 1934 Hayes Dr
- 728 Herlong Ave
- 1953 Plath Top Rd
- 2065 Ebinport Rd
- 2057 Ebinport Rd
- 2049 Ebinport Rd
- 2140 Wentworth Dr
- 2041 Ebinport Rd
- 2148 Wentworth Dr
- 2132 Wentworth Dr
- 2963 Celanese Rd
- 2158 Wentworth Dr
- 2122 Wentworth Dr
- 2168 Wentworth Dr
- 2035 Ebinport Rd
- 2112 Wentworth Dr
- 2172 Ebinport Rd
- 2172 Ebinport Rd
- 2176 Wentworth Dr
- 2104 Wentworth Dr
- 2027 Ebinport Rd
- 2143 Wentworth Dr
- 2151 Wentworth Dr
Your Personal Tour Guide
Ask me questions while you tour the home.