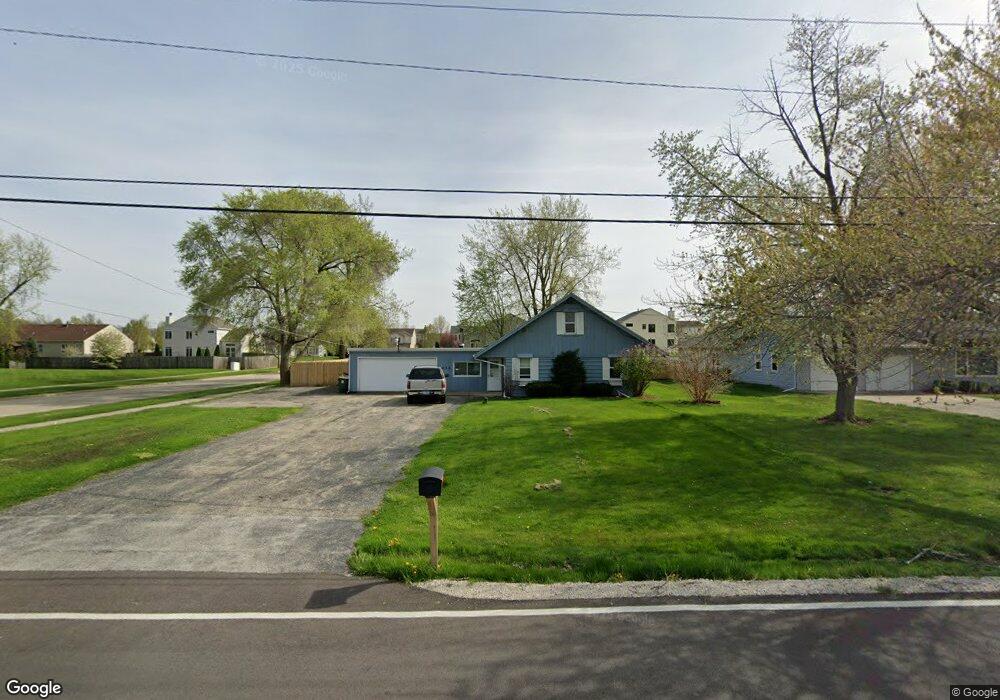
2073 Sheffer Rd Unit 1 Aurora, IL 60502
Indian Creek NeighborhoodEstimated Value: $310,000 - $402,488
3
Beds
2
Baths
1,932
Sq Ft
$187/Sq Ft
Est. Value
About This Home
This home is located at 2073 Sheffer Rd Unit 1, Aurora, IL 60502 and is currently estimated at $360,622, approximately $186 per square foot. 2073 Sheffer Rd Unit 1 is a home located in Kane County with nearby schools including Mabel O Donnell Elementary School, Simmons Middle School, and East Aurora High School.
Ownership History
Date
Name
Owned For
Owner Type
Purchase Details
Closed on
Oct 31, 2011
Sold by
Jenkins Diana
Bought by
2073 Sheffer Road Llc
Current Estimated Value
Purchase Details
Closed on
Nov 3, 2010
Sold by
Jenkins Gary H
Bought by
Jenkins Diana
Purchase Details
Closed on
May 28, 1997
Sold by
Jenkins Gary H
Bought by
Jenkins Gary H and Jenkins Diana
Home Financials for this Owner
Home Financials are based on the most recent Mortgage that was taken out on this home.
Original Mortgage
$111,000
Interest Rate
8.17%
Purchase Details
Closed on
Mar 3, 1993
Sold by
Jenkins Janine L
Bought by
Jenkins Gary H
Create a Home Valuation Report for This Property
The Home Valuation Report is an in-depth analysis detailing your home's value as well as a comparison with similar homes in the area
Home Values in the Area
Average Home Value in this Area
Purchase History
| Date | Buyer | Sale Price | Title Company |
|---|---|---|---|
| 2073 Sheffer Road Llc | $128,000 | Chicago Title Insurance Co | |
| Jenkins Diana | -- | None Available | |
| Jenkins Gary H | -- | -- | |
| Jenkins Gary H | -- | -- |
Source: Public Records
Mortgage History
| Date | Status | Borrower | Loan Amount |
|---|---|---|---|
| Previous Owner | Jenkins Gary H | $111,000 |
Source: Public Records
Tax History
| Year | Tax Paid | Tax Assessment Tax Assessment Total Assessment is a certain percentage of the fair market value that is determined by local assessors to be the total taxable value of land and additions on the property. | Land | Improvement |
|---|---|---|---|---|
| 2024 | $5,788 | $114,537 | $18,563 | $95,974 |
| 2023 | $5,662 | $102,338 | $16,586 | $85,752 |
| 2022 | $5,219 | $93,374 | $15,133 | $78,241 |
| 2021 | $5,209 | $86,932 | $14,089 | $72,843 |
| 2020 | $4,988 | $80,747 | $13,087 | $67,660 |
| 2019 | $4,960 | $74,814 | $12,125 | $62,689 |
| 2018 | $5,007 | $71,929 | $11,215 | $60,714 |
| 2017 | $5,118 | $67,438 | $10,334 | $57,104 |
| 2016 | $5,312 | $64,154 | $8,858 | $55,296 |
| 2015 | -- | $56,313 | $7,617 | $48,696 |
| 2014 | -- | $52,697 | $7,326 | $45,371 |
| 2013 | -- | $56,274 | $7,221 | $49,053 |
Source: Public Records
Map
Nearby Homes
- 1176 Heathrow Ln
- 1771 Briarheath Dr
- 970 Waterside Ct
- 2752 Preserve Cir Unit 13006
- 2748 Preserve Cir Unit 13005
- 2732 Preserve Cir Unit 13001
- 2892 Preserve Cir Unit 5003
- 2888 Preserve Cir Unit 5002
- 1671 Sheffer Rd
- 1037 Parkhill Cir
- 2314 Reflections Dr Unit C0602
- 0000 N Farnsworth Ave
- 2428 Ridgewood Ct
- 1015 Woodview Ct
- Lot 1 Reckinger Rd
- 1110 Oakhill Dr
- 322 4th St
- 907 Harley Ct
- 1223 Townes Cir Unit 48
- 1050 N Farnsworth Ave Unit 111
- 2071 Sheffer Rd Unit 1
- 901 Foxford Ln
- 901 Foxford Lane Rd
- 2044 Stephen St
- 2040 Stephen St
- 2061 Sheffer Rd
- 2052 Stephen St
- 2070 Sheffer Rd
- 2036 Stephen St
- 2151 Sheffer Rd
- 2056 Stephen St Unit 47B
- 2051 Sheffer Rd
- 2032 Stephen St
- 2047 Stephen St
- 2060 Stephen St Unit 47B
- 2130 Sheffer Rd
- 2051 Stephen St Unit 47B
- 2028 Stephen St Unit 47B
- 2161 Sheffer Rd
Your Personal Tour Guide
Ask me questions while you tour the home.