Estimated Value: $342,330 - $368,000
3
Beds
2
Baths
1,823
Sq Ft
$196/Sq Ft
Est. Value
About This Home
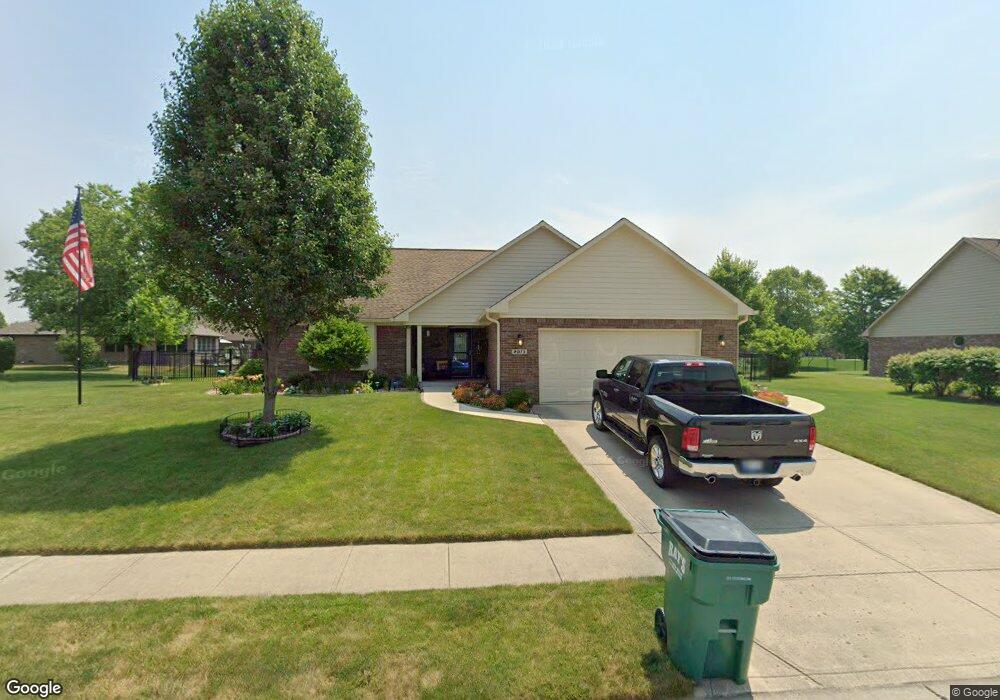
This home is located at 2073 Woodcock Dr, Avon, IN 46123 and is currently estimated at $357,333, approximately $196 per square foot. 2073 Woodcock Dr is a home located in Hendricks County with nearby schools including White Oak Elementary School, Cedar Elementary School, and Avon Intermediate School West.
Ownership History
Date
Name
Owned For
Owner Type
Purchase Details
Closed on
Jun 28, 2021
Sold by
Craig Dustin R and Craig Alyson M
Bought by
Vavrek Terrie Leann and Samons Obra Ann
Current Estimated Value
Home Financials for this Owner
Home Financials are based on the most recent Mortgage that was taken out on this home.
Original Mortgage
$248,500
Outstanding Balance
$225,475
Interest Rate
2.9%
Mortgage Type
New Conventional
Estimated Equity
$131,858
Purchase Details
Closed on
Jan 22, 2021
Sold by
Craig Dustin R and Hottman Alyson M
Bought by
Craig Dustin R and Craig Alyson M
Home Financials for this Owner
Home Financials are based on the most recent Mortgage that was taken out on this home.
Original Mortgage
$172,000
Interest Rate
3%
Mortgage Type
New Conventional
Purchase Details
Closed on
Jul 1, 2013
Sold by
Long Nora E
Bought by
Craig Dustin R and Hottman Alyson M
Home Financials for this Owner
Home Financials are based on the most recent Mortgage that was taken out on this home.
Original Mortgage
$195,395
Interest Rate
4.4%
Mortgage Type
FHA
Create a Home Valuation Report for This Property
The Home Valuation Report is an in-depth analysis detailing your home's value as well as a comparison with similar homes in the area
Home Values in the Area
Average Home Value in this Area
Purchase History
| Date | Buyer | Sale Price | Title Company |
|---|---|---|---|
| Vavrek Terrie Leann | $279,900 | None Available | |
| Craig Dustin R | -- | Vantage Point Title | |
| Craig Dustin R | -- | -- |
Source: Public Records
Mortgage History
| Date | Status | Borrower | Loan Amount |
|---|---|---|---|
| Open | Vavrek Terrie Leann | $248,500 | |
| Previous Owner | Craig Dustin R | $172,000 | |
| Previous Owner | Craig Dustin R | $195,395 |
Source: Public Records
Tax History Compared to Growth
Tax History
| Year | Tax Paid | Tax Assessment Tax Assessment Total Assessment is a certain percentage of the fair market value that is determined by local assessors to be the total taxable value of land and additions on the property. | Land | Improvement |
|---|---|---|---|---|
| 2024 | $2,872 | $315,900 | $40,900 | $275,000 |
| 2023 | $2,595 | $296,800 | $37,200 | $259,600 |
| 2022 | $2,438 | $270,500 | $34,100 | $236,400 |
| 2021 | $1,921 | $228,800 | $34,100 | $194,700 |
| 2020 | $2,524 | $217,900 | $34,100 | $183,800 |
| 2019 | $2,435 | $207,700 | $32,100 | $175,600 |
| 2018 | $2,500 | $209,500 | $32,100 | $177,400 |
| 2017 | $2,028 | $197,800 | $30,100 | $167,700 |
| 2016 | $1,950 | $195,000 | $29,800 | $165,200 |
| 2014 | $1,878 | $187,800 | $28,900 | $158,900 |
Source: Public Records
Map
Nearby Homes
- 6589 Avalon Blvd
- 6374 Timberbluff Cir
- 1914 Delp Ct
- 6229 Catalpa Dr
- 1829 Bentbrook Dr
- 6862 Trailside Dr
- 6012 Yellow Birch Ct
- 6013 Yellow Birch Ct
- 2434 Burgundy Way
- 0 S Avon Ave Unit MBR22032323
- 1914 S State Rd
- 1893 Water Oak Way
- 1810 Salina Dr
- 7128 Verwood Ct
- 1394 Longleaf St
- 1478 S Avon Ave
- 7315 Hidden Valley Dr
- 5985 Pine Bluff Dr
- 7356 Oakview Dr
- 7370 Hidden Valley Dr
- 2089 Woodcock Dr
- 2051 Woodcock Dr
- 6495 Woodcrest Dr
- 6496 Fieldstream Dr
- 2064 Woodcock Dr
- 2080 Woodcock Dr
- 6531 Woodcrest Dr
- 000 Woodcrest Dr
- 6737 Woodcrest Dr
- 81 Woodcrest Dr
- 82 Woodcrest Dr
- 83 Woodcrest Dr
- 84 Woodcrest Dr
- 75 Woodcrest Dr
- 72 Woodcrest Dr
- 71 Woodcrest Dr
- 74 Woodcrest Dr
- 73 Woodcrest Dr
- 69 Woodcrest Dr
- 70 Woodcrest Dr