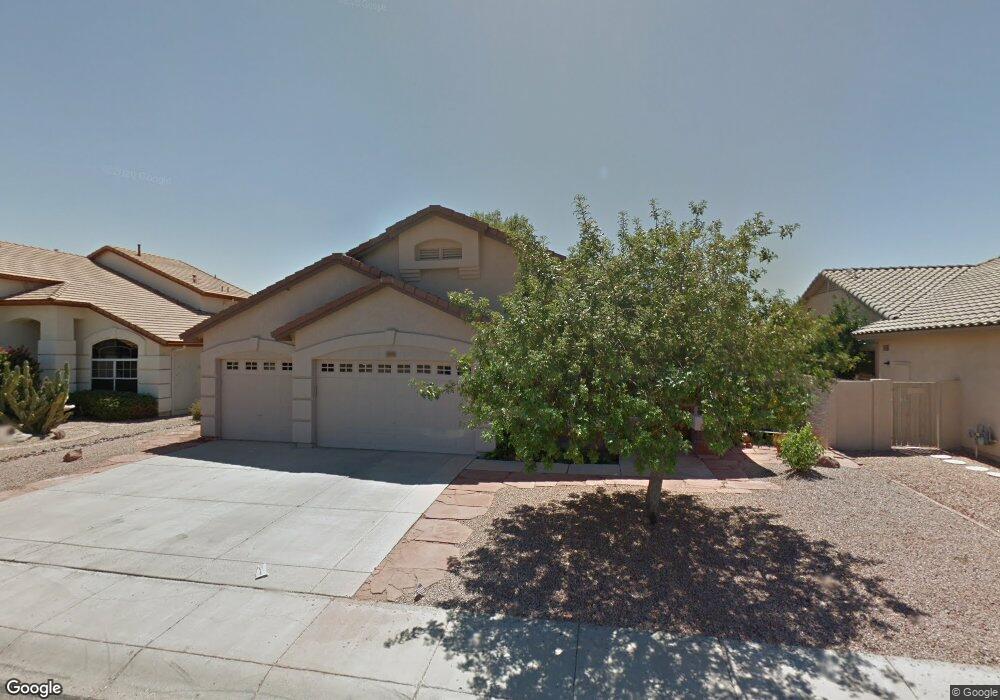
20732 N 55th Ave Glendale, AZ 85308
Arrowhead NeighborhoodEstimated Value: $633,813 - $785,000
3
Beds
3
Baths
2,192
Sq Ft
$332/Sq Ft
Est. Value
About This Home
This home is located at 20732 N 55th Ave, Glendale, AZ 85308 and is currently estimated at $727,953, approximately $332 per square foot. 20732 N 55th Ave is a home located in Maricopa County with nearby schools including Legend Springs Elementary School, Hillcrest Middle School, and Mountain Ridge High School.
Ownership History
Date
Name
Owned For
Owner Type
Purchase Details
Closed on
Feb 4, 2010
Sold by
Givens Linda S and Linda K Smith Revocable Trust
Bought by
Givens Linda Smith and Givens R J
Current Estimated Value
Purchase Details
Closed on
May 30, 2006
Sold by
Smith Linda K
Bought by
Smith Linda K and Linda K Smith Revocable Trust
Purchase Details
Closed on
Sep 5, 2002
Sold by
Smith Linda Kay and Kafouros Linda K
Bought by
Smith Linda Kay
Home Financials for this Owner
Home Financials are based on the most recent Mortgage that was taken out on this home.
Original Mortgage
$127,800
Outstanding Balance
$48,540
Interest Rate
5%
Mortgage Type
Purchase Money Mortgage
Estimated Equity
$679,413
Purchase Details
Closed on
Sep 2, 1996
Sold by
Courtland Homes Inc
Bought by
Kafouros Linda K
Home Financials for this Owner
Home Financials are based on the most recent Mortgage that was taken out on this home.
Original Mortgage
$130,000
Interest Rate
7.88%
Mortgage Type
New Conventional
Create a Home Valuation Report for This Property
The Home Valuation Report is an in-depth analysis detailing your home's value as well as a comparison with similar homes in the area
Home Values in the Area
Average Home Value in this Area
Purchase History
| Date | Buyer | Sale Price | Title Company |
|---|---|---|---|
| Givens Linda Smith | -- | None Available | |
| Smith Linda K | -- | None Available | |
| Smith Linda Kay | -- | Fidelity National Title Co | |
| Kafouros Linda K | $191,445 | First American Title |
Source: Public Records
Mortgage History
| Date | Status | Borrower | Loan Amount |
|---|---|---|---|
| Open | Smith Linda Kay | $127,800 | |
| Closed | Kafouros Linda K | $130,000 | |
| Closed | Smith Linda Kay | $36,162 |
Source: Public Records
Tax History Compared to Growth
Tax History
| Year | Tax Paid | Tax Assessment Tax Assessment Total Assessment is a certain percentage of the fair market value that is determined by local assessors to be the total taxable value of land and additions on the property. | Land | Improvement |
|---|---|---|---|---|
| 2025 | $2,975 | $46,384 | -- | -- |
| 2024 | $3,796 | $44,176 | -- | -- |
| 2023 | $3,796 | $56,420 | $11,280 | $45,140 |
| 2022 | $3,688 | $43,510 | $8,700 | $34,810 |
| 2021 | $3,834 | $42,330 | $8,460 | $33,870 |
| 2020 | $3,786 | $37,330 | $7,460 | $29,870 |
| 2019 | $3,681 | $35,270 | $7,050 | $28,220 |
| 2018 | $3,583 | $34,430 | $6,880 | $27,550 |
| 2017 | $4,074 | $32,920 | $6,580 | $26,340 |
| 2016 | $3,884 | $32,600 | $6,520 | $26,080 |
| 2015 | $3,593 | $33,080 | $6,610 | $26,470 |
Source: Public Records
Map
Nearby Homes
- 20615 N 55th Ave
- 5561 W Rose Garden Ln
- 20390 N 54th Ave
- 21004 N 53rd Ave
- 20391 N 55th Dr
- 5415 W Pontiac Dr
- 21480 N 56th Ave
- 5812 W Del Lago Cir
- 5819 W Abraham Ln Unit 1
- 20735 N 58th Ln
- 5822 W Abraham Ln
- 20283 N 51st Dr Unit 8B
- 5153 W Pontiac Dr
- 21636 N 55th Dr
- 5340 W Melinda Ln
- 19731 N 55th Ave
- 4810 W Tonopah Dr
- 5344 W Oraibi Dr
- 6093 W Irma Ln
- 21614 N 59th Ln
- 20738 N 55th Ave
- 20726 N 55th Ave
- 20744 N 55th Ave
- 20720 N 55th Ave
- 20735 N 55th Ave
- 20729 N 55th Ave
- 20741 N 55th Ave
- 20723 N 55th Ave
- 20750 N 55th Ave Unit 5B
- 5510 W Irma Ln
- 20747 N 55th Ave Unit 5B
- 5516 W Irma Ln
- 20717 N 55th Ave
- 5565 W Irma Ln
- 5563 W Irma Ln
- 5522 W Irma Ln
- 5569 W Irma Ln
- 20810 N 55th Ave Unit 5B
- 5483 W Potter Dr
- 20711 N 55th Ave