Estimated Value: $159,473 - $214,000
About This Home
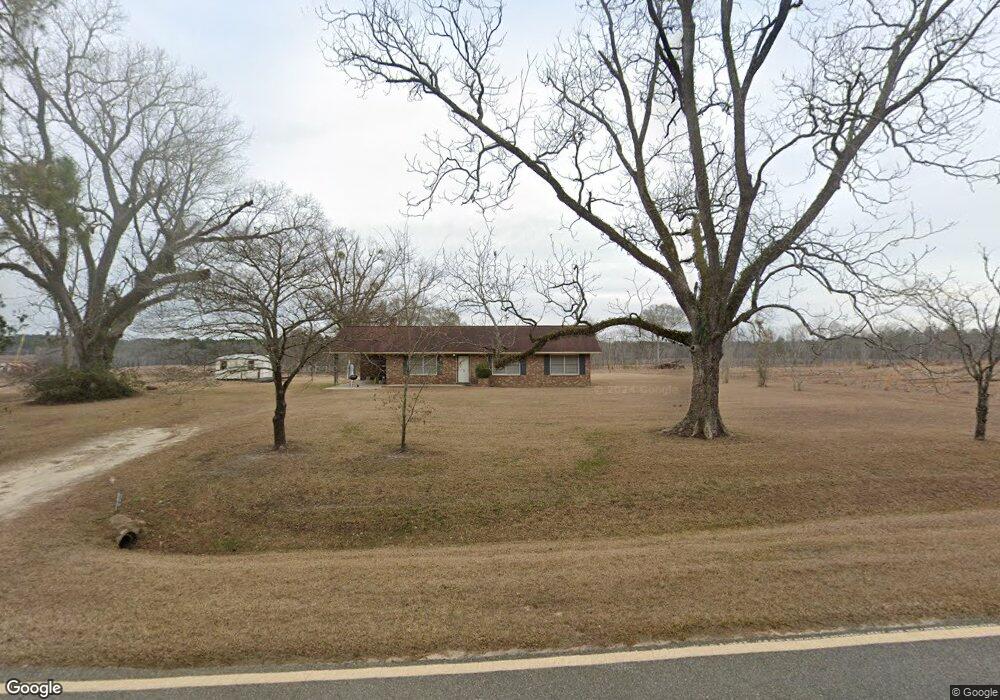
This property located at 2075 Harden Chapel Rd features 3 bedrooms and 2 bathrooms within a total of 1,353 square feet. The living room offers ample space for relaxation and entertainment, while the kitchen is equipped with a dishwasher for convenience. Each bedroom provides sufficient room for furnishings, and one of the bathrooms includes a tub/shower combination while the other is a shower only. Additional amenities include air conditioning, ceiling fans, and high-speed internet access, ensuring comfort and connectivity. The property is smoke-free and includes washer/dryer hookups for laundry convenience. The exterior is well-maintained, providing a welcoming atmosphere. Pets are not allowed.
Ownership History
Purchase Details
Home Financials for this Owner
Home Financials are based on the most recent Mortgage that was taken out on this home.Purchase Details
Purchase History
| Date | Buyer | Sale Price | Title Company |
|---|---|---|---|
| Mavcar Llc | $105,000 | -- | |
| Dees Jim P | -- | -- |
Mortgage History
| Date | Status | Borrower | Loan Amount |
|---|---|---|---|
| Open | Mavcar Llc | $106,839 |
Property History
| Date | Event | Price | List to Sale | Price per Sq Ft |
|---|---|---|---|---|
| 05/13/2025 05/13/25 | Off Market | $1,500 | -- | -- |
| 04/11/2025 04/11/25 | For Rent | $1,500 | -- | -- |
Tax History
| Year | Tax Paid | Tax Assessment Tax Assessment Total Assessment is a certain percentage of the fair market value that is determined by local assessors to be the total taxable value of land and additions on the property. | Land | Improvement |
|---|---|---|---|---|
| 2025 | $1,155 | $52,030 | $3,576 | $48,454 |
| 2024 | $1,180 | $52,030 | $3,576 | $48,454 |
| 2023 | $983 | $49,114 | $3,576 | $45,538 |
| 2022 | $992 | $42,395 | $2,235 | $40,160 |
| 2021 | $393 | $33,179 | $2,235 | $30,944 |
| 2020 | $396 | $30,596 | $1,788 | $28,808 |
| 2019 | $382 | $30,596 | $1,788 | $28,808 |
| 2018 | $382 | $30,596 | $1,788 | $28,808 |
| 2017 | $392 | $29,257 | $1,788 | $27,469 |
| 2016 | $392 | $29,257 | $1,788 | $27,469 |
| 2015 | -- | $23,827 | $600 | $23,228 |
| 2014 | -- | $23,828 | $600 | $23,228 |
Map
- 334 Hidden Hammock
- 600 Thompson Level Rd
- LOT 2 Thompson Level Rd
- 0 Thompson Level Rd
- 1833 Tom Odum Rd
- 1071 George Hill Rd
- 212 Marvin Church Rd
- 4822 Georgia 15
- 451 Tom McDonald Rd
- 6.80 AC Scarlet Rd
- 6.80 AC Scarlet Rd
- 4262 Ga Highway 15
- 00 Simpson Rd
- 0 Us Highway 1 Unit 10526168
- 375 Dasher St
- 1686 Georgia 56
- 0 E Ga Hwy 56 (4 28 Acres) Unit 10639054
- Tract 2 Pine Hollow
- 163 Indigo Rd
- 246 Nelson Ave
- 1984 Harden Chapel Rd
- 107 Lawson Rd
- 2218 Harden Chapel Rd
- 2257 Harden Chapel Rd
- 2251 Harden Chapel Rd
- 1750 Harden Chapel Rd
- 847 Four Acre Rd
- 134 Robert Poole Rd
- 301 Robert Poole Rd
- 220 Lawson Rd
- 210 James Johnson Rd
- 135 Robert Poole Rd
- 1694 Harden Chapel Rd
- 2398 Harden Chapel Rd
- 107 Remer Hackle Rd
- 1725 Harden Chapel Rd
- 831 Four Acre Rd
- 112 James Johnson Rd
- 799 Four Acre Rd
- 153 James Johnson Rd
Ask me questions while you tour the home.