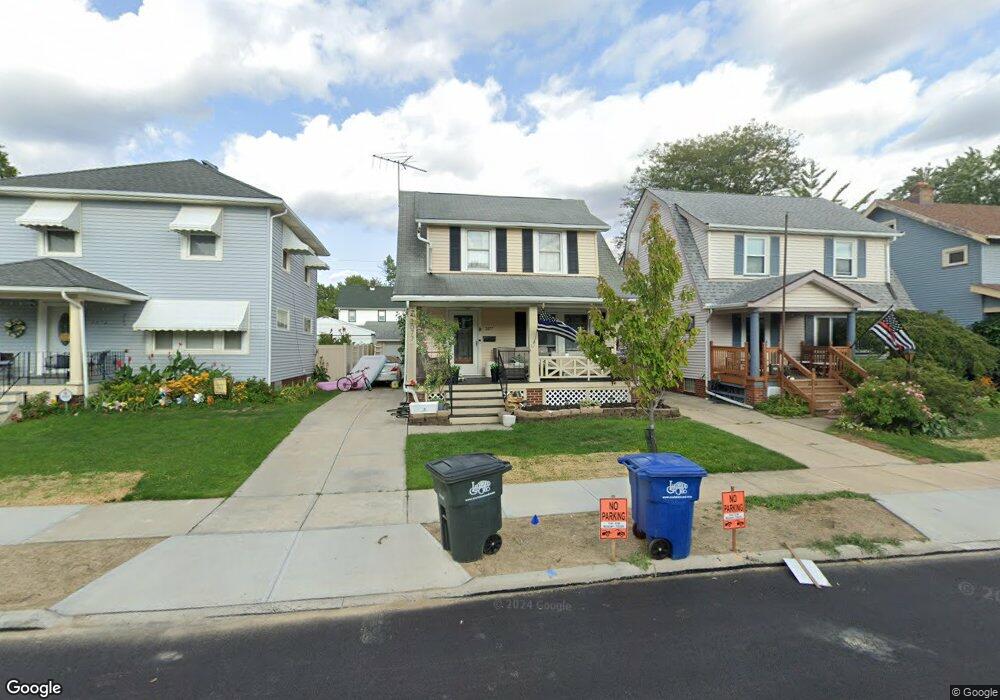
2077 Elmwood Ave Lakewood, OH 44107
Estimated Value: $257,096 - $293,000
3
Beds
1
Bath
1,272
Sq Ft
$213/Sq Ft
Est. Value
About This Home
This home is located at 2077 Elmwood Ave, Lakewood, OH 44107 and is currently estimated at $270,774, approximately $212 per square foot. 2077 Elmwood Ave is a home located in Cuyahoga County with nearby schools including Hayes Elementary School, Harding Middle School, and Lakewood High School.
Ownership History
Date
Name
Owned For
Owner Type
Purchase Details
Closed on
Apr 27, 2004
Sold by
Mcghee Brenda L
Bought by
Mcghee Dean A
Current Estimated Value
Purchase Details
Closed on
Aug 4, 2000
Sold by
Muha Joseph A Caco Rosemary M
Bought by
Mcghee Dean A and Mcghee Brenda L
Home Financials for this Owner
Home Financials are based on the most recent Mortgage that was taken out on this home.
Original Mortgage
$106,000
Outstanding Balance
$38,489
Interest Rate
8.24%
Estimated Equity
$232,285
Purchase Details
Closed on
Aug 28, 1992
Sold by
Shorka Steve and Shorka Eve M
Bought by
Muha Joseph A
Purchase Details
Closed on
Jul 15, 1987
Sold by
Konestabo Frank G
Bought by
Shorka Steve and Shorka Eve M
Purchase Details
Closed on
Feb 9, 1983
Sold by
Konestabo Frank G and Konestabo Bonnie J
Bought by
Konestabo Frank G
Purchase Details
Closed on
Jan 1, 1975
Bought by
Konestabo Frank G and Konestabo Bonnie J
Create a Home Valuation Report for This Property
The Home Valuation Report is an in-depth analysis detailing your home's value as well as a comparison with similar homes in the area
Home Values in the Area
Average Home Value in this Area
Purchase History
| Date | Buyer | Sale Price | Title Company |
|---|---|---|---|
| Mcghee Dean A | -- | -- | |
| Mcghee Dean A | $125,000 | Gateway Title Agency Inc | |
| Muha Joseph A | $88,000 | -- | |
| Shorka Steve | $67,000 | -- | |
| Konestabo Frank G | -- | -- | |
| Konestabo Frank G | -- | -- |
Source: Public Records
Mortgage History
| Date | Status | Borrower | Loan Amount |
|---|---|---|---|
| Open | Mcghee Dean A | $106,000 |
Source: Public Records
Tax History Compared to Growth
Tax History
| Year | Tax Paid | Tax Assessment Tax Assessment Total Assessment is a certain percentage of the fair market value that is determined by local assessors to be the total taxable value of land and additions on the property. | Land | Improvement |
|---|---|---|---|---|
| 2024 | $4,568 | $71,120 | $15,435 | $55,685 |
| 2023 | $4,912 | $65,450 | $12,810 | $52,640 |
| 2022 | $4,944 | $65,450 | $12,810 | $52,640 |
| 2021 | $4,893 | $65,450 | $12,810 | $52,640 |
| 2020 | $4,341 | $50,750 | $9,940 | $40,810 |
| 2019 | $4,255 | $145,000 | $28,400 | $116,600 |
| 2018 | $4,248 | $50,750 | $9,940 | $40,810 |
| 2017 | $3,825 | $41,510 | $7,560 | $33,950 |
| 2016 | $3,799 | $41,510 | $7,560 | $33,950 |
| 2015 | $5,868 | $41,510 | $7,560 | $33,950 |
| 2014 | $5,868 | $39,900 | $7,280 | $32,620 |
Source: Public Records
Map
Nearby Homes
- 14924 Arden Ave
- 14909 Arden Ave
- 14926 Esther Ave
- 2087 Lakeland Ave
- 2165 Arthur Ave
- 14924 Delaware Ave
- 2209 Alger Rd
- 15555 Hilliard Rd Unit 401A
- 2230 Alger Rd
- 1578 Mars Ave
- 14404 Bayes Ave
- 1594 Victoria Ave
- 1617 Westwood Ave
- 14428 Delaware Ave
- 2263 Warren Rd
- 2078 Baxterly Ave
- 2191 Lincoln Ave
- 2234 Olive Ave
- 1593 Marlowe Ave
- 15615 Fernway Ave
- 2081 Elmwood Ave
- 2073 Elmwood Ave
- 2085 Elmwood Ave
- 2069 Elmwood Ave
- 2076 Reveley Ave
- 2072 Reveley Ave
- 2089 Elmwood Ave
- 2065 Elmwood Ave
- 2080 Reveley Ave
- 2068 Reveley Ave
- 2084 Reveley Ave
- 2091 Elmwood Ave
- 2063 Elmwood Ave
- 2064 Reveley Ave
- 2080 Elmwood Ave
- 2084 Elmwood Ave
- 2086 Elmwood Ave
- 2072 Elmwood Ave
- 2088 Reveley Ave
- 2095 Elmwood Ave