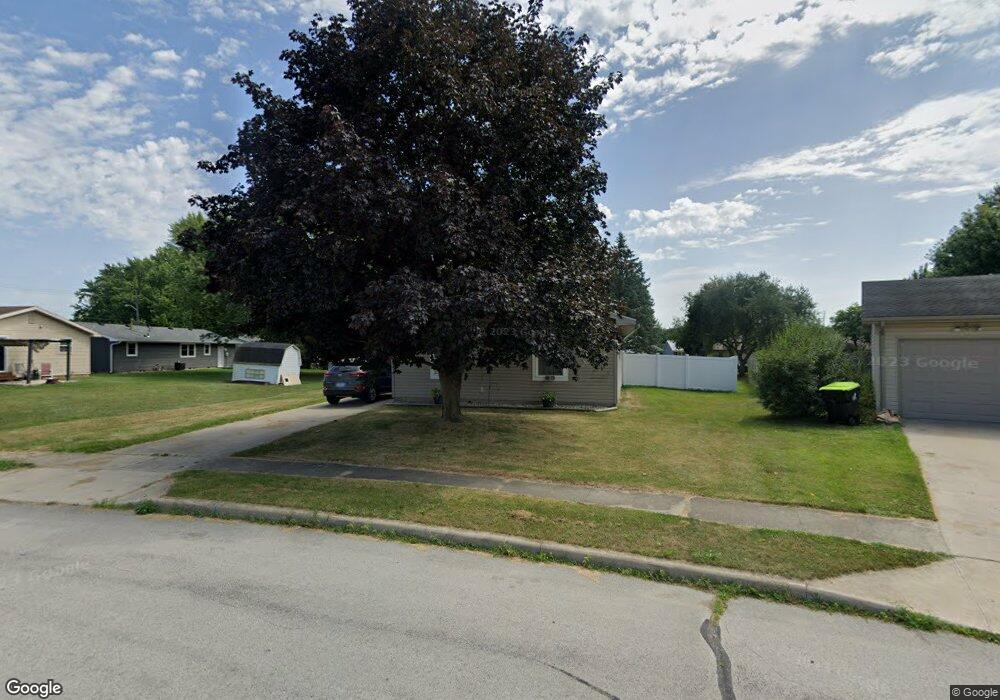
2078 Camden Ct Huntington, IN 46750
Estimated Value: $153,000 - $178,000
2
Beds
1
Bath
978
Sq Ft
$166/Sq Ft
Est. Value
About This Home
This home is located at 2078 Camden Ct, Huntington, IN 46750 and is currently estimated at $162,578, approximately $166 per square foot. 2078 Camden Ct is a home located in Huntington County with nearby schools including Lancaster Elementary School, Riverview Middle School, and Huntington North High School.
Ownership History
Date
Name
Owned For
Owner Type
Purchase Details
Closed on
Aug 23, 2022
Sold by
Rosen Jeremy D and Whitacre-Rosen Dawn M
Bought by
Whitacre-Rosen Dawn M
Current Estimated Value
Purchase Details
Closed on
Jan 10, 2022
Sold by
Rosen Dawn M Whitacre and Wjitacre Dawn M
Bought by
Whitacre-Rosen Dawn M and Rosen Keremy D
Home Financials for this Owner
Home Financials are based on the most recent Mortgage that was taken out on this home.
Original Mortgage
$74,000
Interest Rate
2.43%
Mortgage Type
New Conventional
Purchase Details
Closed on
Sep 27, 2005
Sold by
Austin Kelly R and Stallsmith Kelly R
Bought by
Whitacre Dawn M
Home Financials for this Owner
Home Financials are based on the most recent Mortgage that was taken out on this home.
Original Mortgage
$71,400
Interest Rate
5.93%
Mortgage Type
New Conventional
Create a Home Valuation Report for This Property
The Home Valuation Report is an in-depth analysis detailing your home's value as well as a comparison with similar homes in the area
Home Values in the Area
Average Home Value in this Area
Purchase History
| Date | Buyer | Sale Price | Title Company |
|---|---|---|---|
| Whitacre-Rosen Dawn M | -- | None Listed On Document | |
| Whitacre-Rosen Dawn M | -- | New Title Company Name | |
| Whitacre Dawn M | -- | None Available |
Source: Public Records
Mortgage History
| Date | Status | Borrower | Loan Amount |
|---|---|---|---|
| Previous Owner | Whitacre-Rosen Dawn M | $74,000 | |
| Previous Owner | Whitacre Dawn M | $71,400 |
Source: Public Records
Tax History Compared to Growth
Tax History
| Year | Tax Paid | Tax Assessment Tax Assessment Total Assessment is a certain percentage of the fair market value that is determined by local assessors to be the total taxable value of land and additions on the property. | Land | Improvement |
|---|---|---|---|---|
| 2024 | $1,169 | $116,900 | $20,000 | $96,900 |
| 2023 | $1,043 | $100,500 | $20,000 | $80,500 |
| 2022 | $936 | $95,700 | $20,000 | $75,700 |
| 2021 | $824 | $84,400 | $20,000 | $64,400 |
| 2020 | $769 | $77,700 | $20,000 | $57,700 |
| 2019 | $769 | $77,700 | $20,000 | $57,700 |
| 2018 | $775 | $77,700 | $20,000 | $57,700 |
| 2017 | $741 | $77,100 | $20,000 | $57,100 |
| 2016 | $609 | $74,100 | $20,000 | $54,100 |
| 2014 | $537 | $70,700 | $20,000 | $50,700 |
| 2013 | $537 | $71,800 | $20,000 | $51,800 |
Source: Public Records
Map
Nearby Homes
- 1961 Bedford Ct
- 8 Topaz Dr
- 1673 Etna Ave
- 1242 Dearborn St
- 1535 Henry St
- 1101 W Joe St
- 1365 Edna St
- 2095 Chief Turtle Ct
- 1279 Lucas Ct
- 1239 Lucas Ct
- 1229 Lucas Ct
- 2210 Miami Trail
- 2200 Miami Trail
- 2207 Miami Trail
- 731 Ogan Ave
- 216 S Lafontaine St
- 222 E Kitt St
- 11 Water St
- 917 W Tipton St
- 720 W Park Dr
- 2068 Camden Ct
- 2110 Engle St
- 2120 Engle St
- 11 Granite Way
- 9 Granite Way
- 2130 Engle St
- 2058 Camden Ct
- 2060 Engle St
- 2057 Camden Ct
- 2015 Stoney Hurst Bend
- 2017 Stoney Hurst Bend
- 2140 Engle St
- 7 Granite Way
- 2019 Stoney Hurst Bend
- 2050 Engle St
- 2013 Stoney Hurst Bend
- 2150 Engle St
- 2047 Camden Ct
- 2040 Engle St
- 2038 Camden Ct