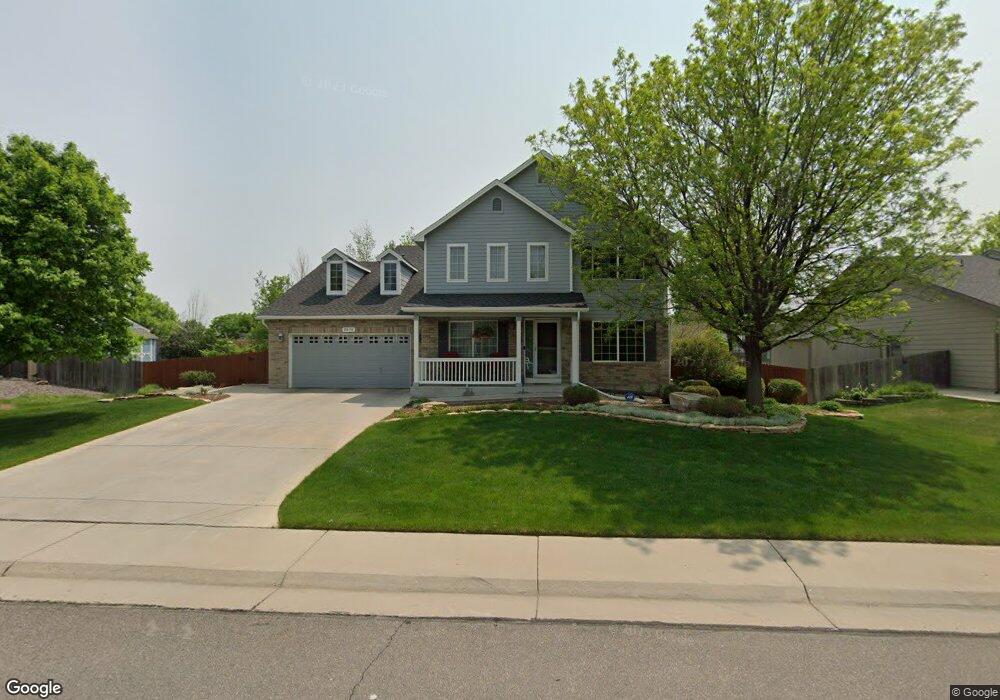
2078 E 144th Way Thornton, CO 80602
Quail Valley NeighborhoodEstimated Value: $723,563 - $833,000
5
Beds
4
Baths
4,027
Sq Ft
$193/Sq Ft
Est. Value
About This Home
This home is located at 2078 E 144th Way, Thornton, CO 80602 and is currently estimated at $778,891, approximately $193 per square foot. 2078 E 144th Way is a home located in Adams County with nearby schools including Silver Creek Elementary School, Rocky Top Middle School, and Mountain Range High School.
Ownership History
Date
Name
Owned For
Owner Type
Purchase Details
Closed on
Jan 24, 2017
Sold by
Mangers Galen Edward
Bought by
Mangers Galen Edward and Mangers Erin
Current Estimated Value
Purchase Details
Closed on
Oct 16, 2012
Sold by
Rosenquist Leonard and Rosenquist Shauna E
Bought by
Mangers Galen Edward
Home Financials for this Owner
Home Financials are based on the most recent Mortgage that was taken out on this home.
Original Mortgage
$339,625
Outstanding Balance
$234,291
Interest Rate
3.43%
Mortgage Type
New Conventional
Estimated Equity
$544,600
Purchase Details
Closed on
Aug 15, 2003
Sold by
Melody Homes Inc
Bought by
Rosenquist Leonard and Rosenquist Shauna E
Home Financials for this Owner
Home Financials are based on the most recent Mortgage that was taken out on this home.
Original Mortgage
$207,950
Interest Rate
5.35%
Mortgage Type
Unknown
Create a Home Valuation Report for This Property
The Home Valuation Report is an in-depth analysis detailing your home's value as well as a comparison with similar homes in the area
Home Values in the Area
Average Home Value in this Area
Purchase History
| Date | Buyer | Sale Price | Title Company |
|---|---|---|---|
| Mangers Galen Edward | -- | None Available | |
| Mangers Galen Edward | $357,500 | Ccts | |
| Rosenquist Leonard | $286,217 | Land Title Guarantee Company |
Source: Public Records
Mortgage History
| Date | Status | Borrower | Loan Amount |
|---|---|---|---|
| Open | Mangers Galen Edward | $339,625 | |
| Previous Owner | Rosenquist Leonard | $207,950 |
Source: Public Records
Tax History Compared to Growth
Tax History
| Year | Tax Paid | Tax Assessment Tax Assessment Total Assessment is a certain percentage of the fair market value that is determined by local assessors to be the total taxable value of land and additions on the property. | Land | Improvement |
|---|---|---|---|---|
| 2024 | $4,755 | $42,940 | $8,000 | $34,940 |
| 2023 | $4,706 | $49,660 | $7,510 | $42,150 |
| 2022 | $3,700 | $33,590 | $7,710 | $25,880 |
| 2021 | $3,824 | $33,590 | $7,710 | $25,880 |
| 2020 | $3,782 | $33,900 | $7,720 | $26,180 |
| 2019 | $3,790 | $33,900 | $7,720 | $26,180 |
| 2018 | $3,765 | $32,720 | $7,560 | $25,160 |
| 2017 | $3,423 | $32,720 | $7,560 | $25,160 |
| 2016 | $2,963 | $27,570 | $4,540 | $23,030 |
| 2015 | $2,959 | $27,570 | $4,540 | $23,030 |
| 2014 | $2,685 | $24,320 | $3,980 | $20,340 |
Source: Public Records
Map
Nearby Homes
- 2028 E 145th Ave
- 14558 Vine St
- 14625 Vine St
- 1920 E 145th Ave
- 1936 E 144th Dr
- 14703 High St
- 14642 Williams St
- 14685 Williams St
- 14511 Detroit Way
- 14953 Columbine St
- 14962 Williams St
- 2607 E 142nd Ave
- 14066 Fillmore Dr
- 14447 Madison St
- 15171 Gaylord St
- 14184 Madison St
- 13867 Fillmore St
- 13938 Downing St
- 15122 Fillmore Way
- 3565 E 141st Dr
- 2060 E 144th Way
- 2096 E 144th Way
- 2111 E 144th Place
- 2129 E 144th Place
- 2093 E 144th Place
- 2073 E 144th Way
- 2042 E 144th Way
- 2055 E 144th Way
- 2091 E 144th Way
- 2147 E 144th Place
- 2037 E 144th Way
- 2075 E 144th Place
- 2109 E 144th Way
- 2019 E 144th Way
- 2024 E 144th Way
- 2082 E 145th Ave
- 2057 E 144th Place
- 2165 E 144th Place
- 2116 E 144th Place
- 14471 Gaylord St