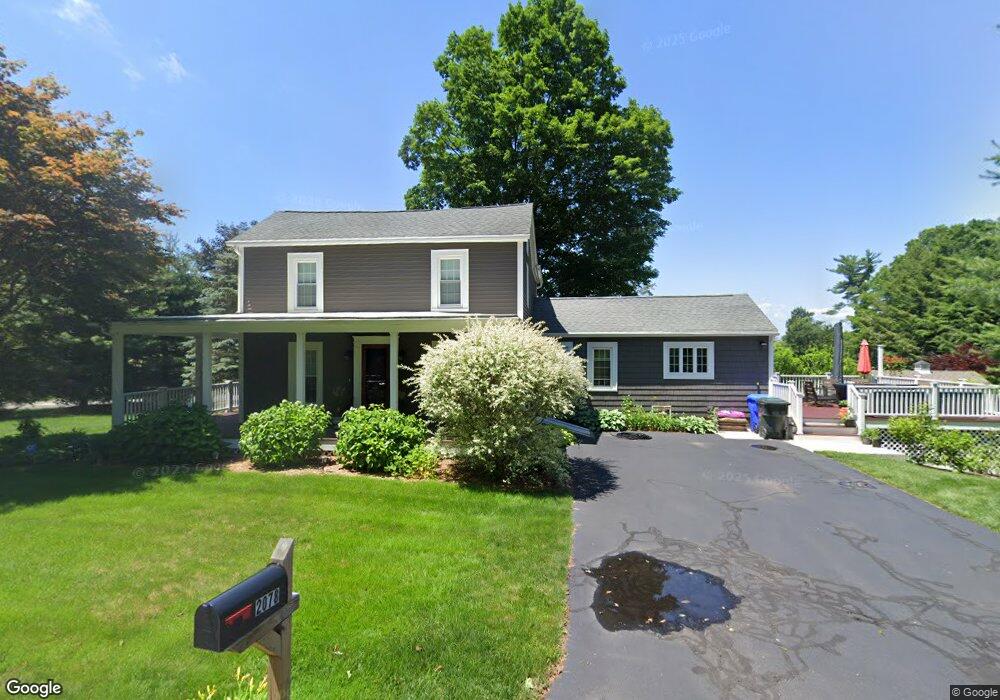
2078 Parker St Springfield, MA 01128
Sixteen Acres NeighborhoodEstimated Value: $341,650 - $376,000
3
Beds
2
Baths
1,484
Sq Ft
$237/Sq Ft
Est. Value
About This Home
This home is located at 2078 Parker St, Springfield, MA 01128 and is currently estimated at $351,163, approximately $236 per square foot. 2078 Parker St is a home located in Hampden County with nearby schools including Daniel B Brunton, M Marcus Kiley Middle, and Springfield High School of Science and Technology.
Ownership History
Date
Name
Owned For
Owner Type
Purchase Details
Closed on
Nov 26, 1997
Sold by
Toomey Brian M and Toomey Susan A
Bought by
Taddia Robert L
Current Estimated Value
Home Financials for this Owner
Home Financials are based on the most recent Mortgage that was taken out on this home.
Original Mortgage
$76,400
Interest Rate
7.26%
Mortgage Type
Purchase Money Mortgage
Purchase Details
Closed on
Mar 22, 1991
Sold by
Aldrich Peter T
Bought by
Toomey Brian M and Loyack Susan A
Create a Home Valuation Report for This Property
The Home Valuation Report is an in-depth analysis detailing your home's value as well as a comparison with similar homes in the area
Home Values in the Area
Average Home Value in this Area
Purchase History
| Date | Buyer | Sale Price | Title Company |
|---|---|---|---|
| Taddia Robert L | $95,500 | -- | |
| Toomey Brian M | $105,000 | -- |
Source: Public Records
Mortgage History
| Date | Status | Borrower | Loan Amount |
|---|---|---|---|
| Open | Toomey Brian M | $25,000 | |
| Open | Toomey Brian M | $69,000 | |
| Closed | Toomey Brian M | $76,400 | |
| Previous Owner | Toomey Brian M | $103,696 |
Source: Public Records
Tax History
| Year | Tax Paid | Tax Assessment Tax Assessment Total Assessment is a certain percentage of the fair market value that is determined by local assessors to be the total taxable value of land and additions on the property. | Land | Improvement |
|---|---|---|---|---|
| 2025 | $4,331 | $276,200 | $60,400 | $215,800 |
| 2024 | $4,383 | $272,900 | $60,400 | $212,500 |
| 2023 | $4,610 | $270,400 | $57,500 | $212,900 |
| 2022 | $4,379 | $232,700 | $57,500 | $175,200 |
| 2021 | $4,186 | $221,500 | $52,200 | $169,300 |
| 2020 | $3,894 | $199,400 | $52,200 | $147,200 |
| 2019 | $3,716 | $188,800 | $52,200 | $136,600 |
| 2018 | $3,533 | $179,500 | $52,200 | $127,300 |
| 2017 | $3,429 | $174,400 | $52,200 | $122,200 |
| 2016 | $3,454 | $175,700 | $52,200 | $123,500 |
| 2015 | $3,316 | $168,600 | $52,200 | $116,400 |
Source: Public Records
Map
Nearby Homes
- 55 Allen St
- 0 Apple Blossom Ln
- 17 Skyridge Ln
- 111 Malibu Dr
- 15 Lynwood Rd
- 25 Laurelwood Ln
- 16 Deerfoot Dr
- 78 Meadow Rd
- 65 Fair Oak Rd
- 98 Brookhaven Dr
- 41 Hillside Dr
- 82 Louis Rd
- 72 Tanglewood Dr
- 85 Talmadge Dr
- 86 Talmadge Dr
- 46 Holland Dr
- 865 S Branch Pkwy
- 42 Talmadge Dr
- 123 Mountainview Rd
- 31 Acrebrook Rd