Estimated Value: $367,000 - $405,000
4
Beds
2
Baths
1,500
Sq Ft
$256/Sq Ft
Est. Value
About This Home
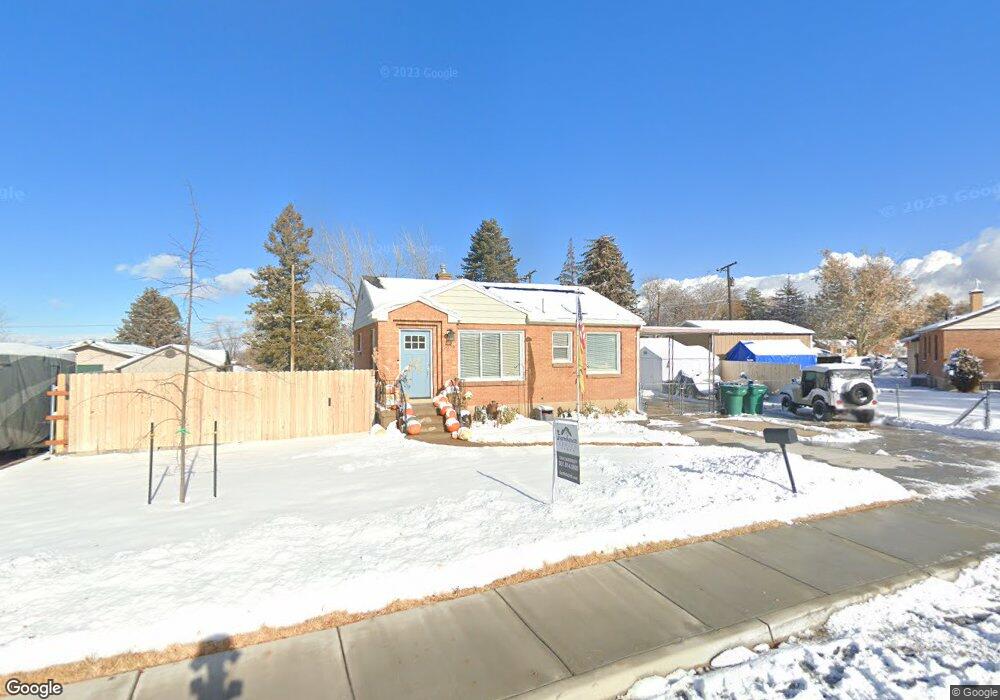
This home is located at 2078 W 3950 S, Roy, UT 84067 and is currently estimated at $384,715, approximately $256 per square foot. 2078 W 3950 S is a home located in Weber County with nearby schools including North Park School, Sand Ridge Junior High School, and Roy High School.
Ownership History
Date
Name
Owned For
Owner Type
Purchase Details
Closed on
May 29, 2024
Sold by
Guimond Joshua A
Bought by
Muniz Johnny and Muniz David Mark
Current Estimated Value
Purchase Details
Closed on
Dec 18, 2019
Sold by
Gee Bryan
Bought by
Guimond Joshua A
Home Financials for this Owner
Home Financials are based on the most recent Mortgage that was taken out on this home.
Original Mortgage
$276,210
Interest Rate
2.8%
Mortgage Type
VA
Purchase Details
Closed on
Apr 21, 2017
Sold by
Duke Partners Ii Llc
Bought by
Gee Bryan
Home Financials for this Owner
Home Financials are based on the most recent Mortgage that was taken out on this home.
Original Mortgage
$166,920
Interest Rate
3.75%
Mortgage Type
FHA
Create a Home Valuation Report for This Property
The Home Valuation Report is an in-depth analysis detailing your home's value as well as a comparison with similar homes in the area
Home Values in the Area
Average Home Value in this Area
Purchase History
| Date | Buyer | Sale Price | Title Company |
|---|---|---|---|
| Muniz Johnny | -- | Backman Title | |
| Guimond Joshua A | -- | Metro National Title | |
| Gee Bryan | -- | Security Title Ins Agenncy |
Source: Public Records
Mortgage History
| Date | Status | Borrower | Loan Amount |
|---|---|---|---|
| Previous Owner | Guimond Joshua A | $276,210 | |
| Previous Owner | Gee Bryan | $166,920 |
Source: Public Records
Tax History Compared to Growth
Tax History
| Year | Tax Paid | Tax Assessment Tax Assessment Total Assessment is a certain percentage of the fair market value that is determined by local assessors to be the total taxable value of land and additions on the property. | Land | Improvement |
|---|---|---|---|---|
| 2025 | $2,119 | $325,774 | $125,672 | $200,102 |
| 2024 | $2,072 | $176,549 | $69,178 | $107,371 |
| 2023 | $1,914 | $162,250 | $62,879 | $99,371 |
| 2022 | $2,028 | $178,750 | $54,630 | $124,120 |
| 2021 | $1,775 | $258,000 | $69,035 | $188,965 |
| 2020 | $1,511 | $199,000 | $69,035 | $129,965 |
| 2019 | $1,518 | $189,000 | $43,265 | $145,735 |
| 2018 | $1,334 | $154,000 | $38,143 | $115,857 |
| 2017 | $1,160 | $123,000 | $36,118 | $86,882 |
| 2016 | $1,114 | $63,384 | $14,236 | $49,148 |
| 2015 | $953 | $54,148 | $17,577 | $36,571 |
| 2014 | $913 | $50,857 | $17,577 | $33,280 |
Source: Public Records
Map
Nearby Homes
- 2096 W 3950 S
- 2070 W 4000 S
- 2050 W 4000 S
- 3923 S 1975 W Unit 15
- 3965 S 2225 W
- 1959 3985 St S Unit 2
- 4073 S 2175 W
- 1910 W 3920 S
- 4110 S 2275 W
- 3854 S 1925 W
- 4205 S 2075 W
- 4220 S 2075 W
- 3860 Midland Dr Unit C10
- 3860 Midland Dr Unit B32
- 4164 S 2400 W
- 2015 W 4225 S
- 3800 S 1900 W Unit 28
- 3800 S 1900 W Unit 64
- 3800 S 1900 W Unit 66
- 3800 S 1900 W Unit 89