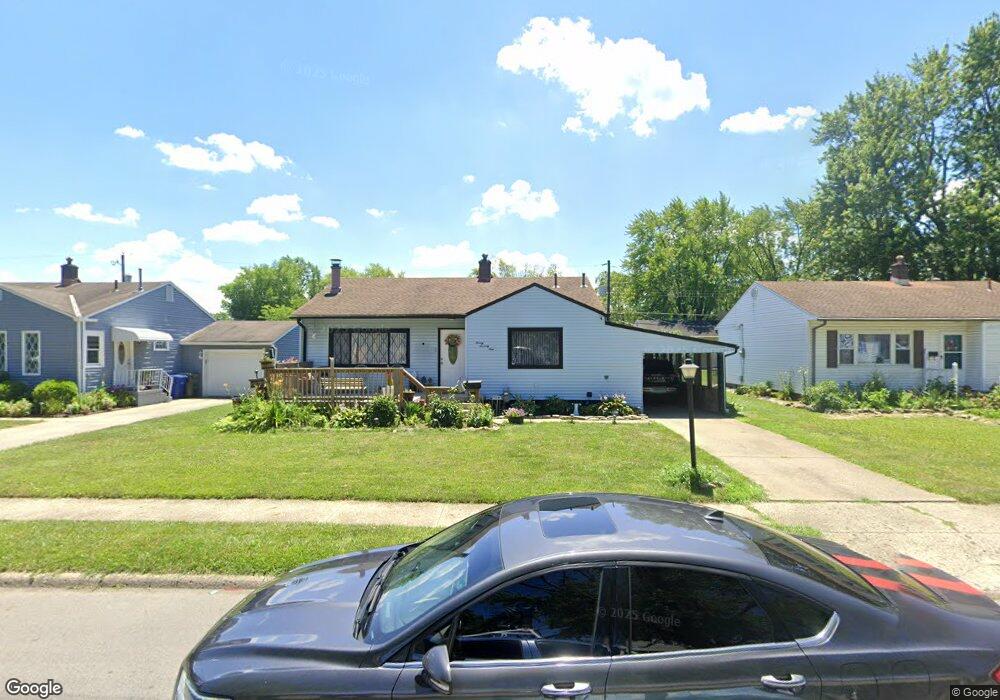
2079 Belcher Dr Columbus, OH 43224
North Linden NeighborhoodEstimated Value: $146,000 - $197,000
2
Beds
1
Bath
914
Sq Ft
$187/Sq Ft
Est. Value
About This Home
This home is located at 2079 Belcher Dr, Columbus, OH 43224 and is currently estimated at $171,320, approximately $187 per square foot. 2079 Belcher Dr is a home located in Franklin County with nearby schools including North Linden Elementary School, Medina Middle School, and Mifflin High School.
Ownership History
Date
Name
Owned For
Owner Type
Purchase Details
Closed on
Jun 2, 2021
Sold by
Mays Jennifer L
Bought by
Ocl Investments Llc
Current Estimated Value
Purchase Details
Closed on
Apr 13, 2018
Sold by
Houston Bentley Cynthia Sue and The Estate Of Charles L Housto
Bought by
Mays Jennifer L
Home Financials for this Owner
Home Financials are based on the most recent Mortgage that was taken out on this home.
Original Mortgage
$62,662
Interest Rate
4.43%
Mortgage Type
New Conventional
Purchase Details
Closed on
Mar 9, 2018
Sold by
Houston Charles L and Houston Mary L
Bought by
Houston Charles L
Home Financials for this Owner
Home Financials are based on the most recent Mortgage that was taken out on this home.
Original Mortgage
$62,662
Interest Rate
4.43%
Mortgage Type
New Conventional
Purchase Details
Closed on
Jul 7, 1965
Bought by
Houston Charles L
Create a Home Valuation Report for This Property
The Home Valuation Report is an in-depth analysis detailing your home's value as well as a comparison with similar homes in the area
Home Values in the Area
Average Home Value in this Area
Purchase History
| Date | Buyer | Sale Price | Title Company |
|---|---|---|---|
| Ocl Investments Llc | $115,000 | Northwest Select Title | |
| Mays Jennifer L | $64,600 | Associates Title Inc | |
| Houston Charles L | -- | None Available | |
| Houston Charles L | -- | -- |
Source: Public Records
Mortgage History
| Date | Status | Borrower | Loan Amount |
|---|---|---|---|
| Previous Owner | Mays Jennifer L | $62,662 |
Source: Public Records
Tax History Compared to Growth
Tax History
| Year | Tax Paid | Tax Assessment Tax Assessment Total Assessment is a certain percentage of the fair market value that is determined by local assessors to be the total taxable value of land and additions on the property. | Land | Improvement |
|---|---|---|---|---|
| 2024 | $2,664 | $58,140 | $12,250 | $45,890 |
| 2023 | $2,781 | $58,135 | $12,250 | $45,885 |
| 2022 | $1,653 | $28,290 | $5,500 | $22,790 |
| 2021 | $1,610 | $28,290 | $5,500 | $22,790 |
| 2020 | $1,611 | $28,290 | $5,500 | $22,790 |
| 2019 | $1,359 | $22,400 | $4,410 | $17,990 |
| 2018 | $1,119 | $22,400 | $4,410 | $17,990 |
| 2017 | $879 | $22,400 | $4,410 | $17,990 |
| 2016 | $933 | $22,830 | $4,100 | $18,730 |
| 2015 | $847 | $22,830 | $4,100 | $18,730 |
| 2014 | $849 | $22,830 | $4,100 | $18,730 |
| 2013 | $493 | $25,340 | $4,550 | $20,790 |
Source: Public Records
Map
Nearby Homes
- 4309 Walford St
- 4217 Hickman Rd
- 2144 Colfax Ave
- 2194 Ashley Dr
- 4111 Walford St
- 1997 Ferris Rd
- 1863 Ward Rd
- 2023 Ferris Rd
- 2283 Ward Rd
- 1936 Case Rd
- 2220 Sale Rd
- 1734 Ferris Rd
- 4090 Cleveland Ave
- 2219 Sale Rd
- 1896 Ormond Ave
- 4714 Ascot Dr
- 2244 Balmoral Rd
- 2594 Adda Ave
- 4057 Estates Place
- 2151 Trent Rd
- 2071 Belcher Dr
- 2087 Belcher Dr
- 2080 Eden Ave
- 2072 Eden Ave
- 2088 Eden Ave
- 2063 Belcher Dr
- 2095 Belcher Dr
- 2062 Eden Ave
- 2096 Eden Ave
- 2084 Belcher Dr
- 2076 Belcher Dr
- 2070 Belcher Dr
- 2090 Belcher Dr
- 4304 Walford St
- 2064 Belcher Dr
- 2096 Belcher Dr
- 4292 Walford St
- 2104 Eden Ave
- 2104 Belcher Dr
- 4326 Walford St