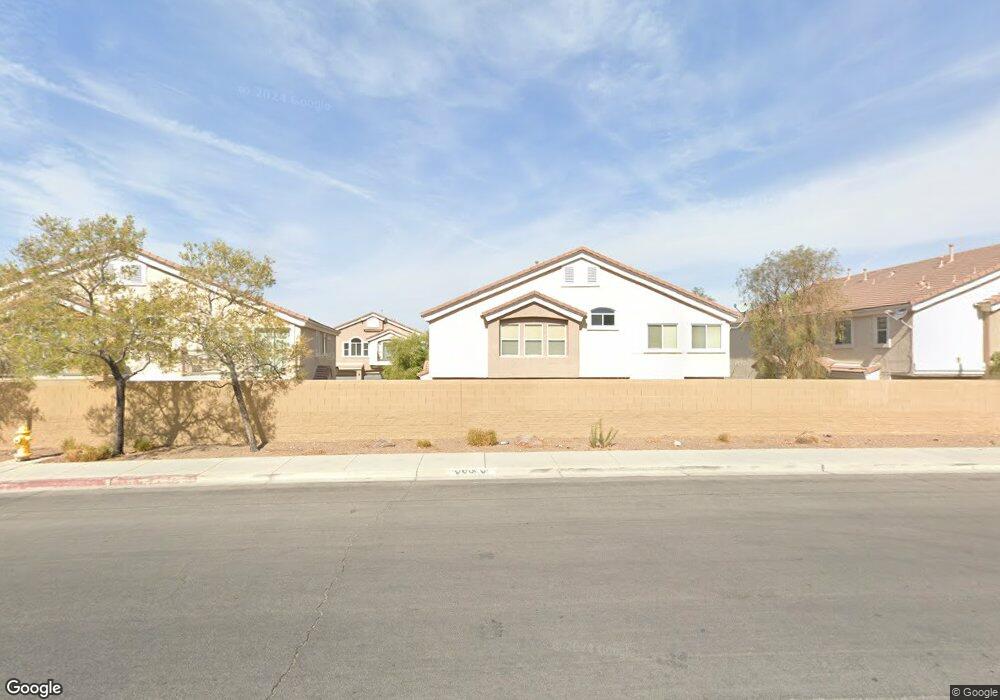
2079 Scanlon Ferry Ct Unit 103 Las Vegas, NV 89156
Estimated Value: $291,070 - $395,000
3
Beds
3
Baths
1,685
Sq Ft
$192/Sq Ft
Est. Value
About This Home
This home is located at 2079 Scanlon Ferry Ct Unit 103, Las Vegas, NV 89156 and is currently estimated at $324,268, approximately $192 per square foot. 2079 Scanlon Ferry Ct Unit 103 is a home located in Clark County with nearby schools including Helen Herr Elementary School, Dr. William H. Bailey Middle School, and Sunrise Mountain High School.
Ownership History
Date
Name
Owned For
Owner Type
Purchase Details
Closed on
Jul 6, 2012
Sold by
Zamudio Monica
Bought by
Flores Raul
Current Estimated Value
Purchase Details
Closed on
Sep 1, 2011
Sold by
Flores Raul and Zamudio Monica
Bought by
Flores Raul
Purchase Details
Closed on
Jun 18, 2008
Sold by
D R Horton Inc
Bought by
Flores Raul and Zamudio Monica
Home Financials for this Owner
Home Financials are based on the most recent Mortgage that was taken out on this home.
Original Mortgage
$191,519
Interest Rate
6.04%
Mortgage Type
FHA
Purchase Details
Closed on
Jun 3, 2008
Sold by
Zamudio Pedro
Bought by
Zamudio Monica
Home Financials for this Owner
Home Financials are based on the most recent Mortgage that was taken out on this home.
Original Mortgage
$191,519
Interest Rate
6.04%
Mortgage Type
FHA
Create a Home Valuation Report for This Property
The Home Valuation Report is an in-depth analysis detailing your home's value as well as a comparison with similar homes in the area
Home Values in the Area
Average Home Value in this Area
Purchase History
| Date | Buyer | Sale Price | Title Company |
|---|---|---|---|
| Flores Raul | -- | None Available | |
| Flores Raul | -- | None Available | |
| Flores Raul | $194,525 | Dhi Title | |
| Zamudio Monica | -- | Dhi Title |
Source: Public Records
Mortgage History
| Date | Status | Borrower | Loan Amount |
|---|---|---|---|
| Previous Owner | Flores Raul | $191,519 |
Source: Public Records
Tax History Compared to Growth
Tax History
| Year | Tax Paid | Tax Assessment Tax Assessment Total Assessment is a certain percentage of the fair market value that is determined by local assessors to be the total taxable value of land and additions on the property. | Land | Improvement |
|---|---|---|---|---|
| 2025 | $858 | $86,140 | $19,950 | $66,190 |
| 2024 | $833 | $86,140 | $19,950 | $66,190 |
| 2023 | $833 | $82,078 | $21,700 | $60,378 |
| 2022 | $809 | $73,136 | $16,100 | $57,036 |
| 2021 | $786 | $60,439 | $14,000 | $46,439 |
| 2020 | $760 | $64,286 | $16,100 | $48,186 |
| 2019 | $738 | $59,611 | $11,900 | $47,711 |
| 2018 | $716 | $46,831 | $9,800 | $37,031 |
| 2017 | $1,248 | $41,582 | $7,350 | $34,232 |
| 2016 | $680 | $37,945 | $6,650 | $31,295 |
| 2015 | $677 | $30,762 | $4,900 | $25,862 |
| 2014 | $657 | $20,775 | $3,500 | $17,275 |
Source: Public Records
Map
Nearby Homes
- 2092 Scanlon Ferry Ct Unit 102
- 6434 Elwood Mead Ave Unit 103
- 6560 Bush Clover Ln
- 1971 Eskam St
- 1905 Eskam St
- 1932 Spindrift Ct
- 2257 Bridle Wreath Ln
- 6741 Solaron Ave
- 2300 Monterey Pine Dr
- 6201 E Lake Mead Blvd Unit 175
- 6201 E Lake Mead Blvd Unit 151
- 6201 E Lake Mead Blvd Unit E218
- 6760 Fallona Ave
- 6255 Bryce Canyon Ave
- 6800 E Lake Mead Blvd Unit 1062
- 6800 E Lake Mead Blvd Unit 2024
- 6800 E Lake Mead Blvd Unit 1048
- 6800 E Lake Mead Blvd Unit 1113
- 6800 E Lake Mead Blvd Unit 2026
- 6800 E Lake Mead Blvd Unit 1002
- 2079 Scanlon Ferry Ct
- 2079 Scanlon Ferry Ct Unit 102
- 2079 Scanlon Ferry Ct Unit 101
- 2065 Scanlon Ferry Ct Unit 101
- 2065 Scanlon Ferry Ct Unit 103
- 2065 Scanlon Ferry Ct Unit 102
- 2078 Scanlon Ferry Ct Unit 101
- 2078 Scanlon Ferry Ct Unit 103
- 2078 Scanlon Ferry Ct Unit 102
- 2092 Scanlon Ferry Ct Unit 103
- 2092 Scanlon Ferry Ct Unit 101
- 2064 Scanlon Ferry Ct
- 2064 Scanlon Ferry Ct Unit 103
- 2064 Scanlon Ferry Ct Unit 101
- 2064 Scanlon Ferry Ct Unit 102
- 2080 Homestake Mine Ct Unit none
- 2080 Homestake Mine Ct
- 2080 Homestake Mine Ct Unit 102
- 2080 Homestake Mine Ct Unit 103
- 2080 Homestake Mine Ct Unit 101