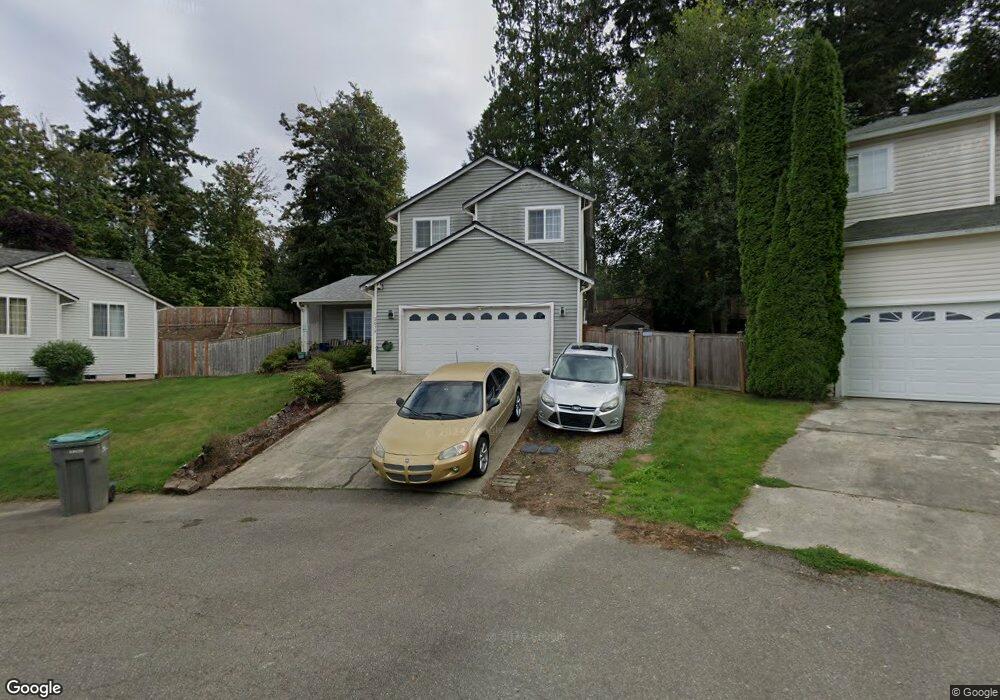
2079 Tidepool Place E Port Orchard, WA 98366
Parkwood NeighborhoodEstimated Value: $552,516 - $598,000
4
Beds
3
Baths
2,198
Sq Ft
$258/Sq Ft
Est. Value
About This Home
This home is located at 2079 Tidepool Place E, Port Orchard, WA 98366 and is currently estimated at $566,879, approximately $257 per square foot. 2079 Tidepool Place E is a home located in Kitsap County with nearby schools including Orchard Heights Elementary School, Marcus Whitman Middle School, and South Kitsap High School.
Ownership History
Date
Name
Owned For
Owner Type
Purchase Details
Closed on
Aug 17, 2006
Sold by
Odey Sarah H and Odey Edward J
Bought by
Weathington Matthew M and Weathington Marline D
Current Estimated Value
Home Financials for this Owner
Home Financials are based on the most recent Mortgage that was taken out on this home.
Original Mortgage
$308,655
Outstanding Balance
$165,620
Interest Rate
4.87%
Mortgage Type
New Conventional
Estimated Equity
$401,259
Purchase Details
Closed on
Aug 21, 2003
Sold by
Williams Clemmie and Cummings Carla
Bought by
Odey Ii Edward J and Odey Sarah H
Home Financials for this Owner
Home Financials are based on the most recent Mortgage that was taken out on this home.
Original Mortgage
$194,750
Interest Rate
5.46%
Mortgage Type
Purchase Money Mortgage
Purchase Details
Closed on
Oct 31, 2001
Sold by
Boardwalk Homes Inc
Bought by
Williams Clemmie
Home Financials for this Owner
Home Financials are based on the most recent Mortgage that was taken out on this home.
Original Mortgage
$168,300
Interest Rate
6.84%
Mortgage Type
VA
Create a Home Valuation Report for This Property
The Home Valuation Report is an in-depth analysis detailing your home's value as well as a comparison with similar homes in the area
Home Values in the Area
Average Home Value in this Area
Purchase History
| Date | Buyer | Sale Price | Title Company |
|---|---|---|---|
| Weathington Matthew M | $325,180 | Land Title Company | |
| Odey Ii Edward J | $205,000 | Transnation Title Ins Co | |
| Williams Clemmie | $166,000 | Chicago Title Insurance Comp |
Source: Public Records
Mortgage History
| Date | Status | Borrower | Loan Amount |
|---|---|---|---|
| Open | Weathington Matthew M | $308,655 | |
| Previous Owner | Odey Ii Edward J | $194,750 | |
| Previous Owner | Williams Clemmie | $168,300 |
Source: Public Records
Tax History Compared to Growth
Tax History
| Year | Tax Paid | Tax Assessment Tax Assessment Total Assessment is a certain percentage of the fair market value that is determined by local assessors to be the total taxable value of land and additions on the property. | Land | Improvement |
|---|---|---|---|---|
| 2026 | $4,149 | $483,150 | $82,400 | $400,750 |
| 2025 | $4,149 | $472,610 | $67,660 | $404,950 |
| 2024 | $4,023 | $472,610 | $67,660 | $404,950 |
| 2023 | $3,997 | $472,610 | $67,660 | $404,950 |
| 2022 | $3,920 | $388,410 | $63,190 | $325,220 |
| 2021 | $3,785 | $354,900 | $58,720 | $296,180 |
| 2020 | $3,712 | $338,190 | $55,920 | $282,270 |
| 2019 | $3,101 | $309,450 | $54,940 | $254,510 |
| 2018 | $3,229 | $248,620 | $54,940 | $193,680 |
| 2017 | $2,748 | $248,620 | $54,940 | $193,680 |
| 2016 | $2,675 | $221,410 | $54,940 | $166,470 |
| 2015 | $2,583 | $216,610 | $54,940 | $161,670 |
| 2014 | -- | $213,410 | $54,940 | $158,470 |
| 2013 | -- | $222,860 | $57,830 | $165,030 |
Source: Public Records
Map
Nearby Homes
- 4233 SE Horsehead Way
- 659 SE Olga Cir
- 3817 SE Horstman Rd
- 4010 SE Lovell St
- 4305 SE Elijah Ct
- 0 Wendell Ave SE
- 3930 SE Mile Hill Dr
- 3900 SE Mile Hill Dr
- 1663 Harrison Ave SE
- 1703 Harrison Ave SE
- 1341 Salt Point Place E
- 3589 SE Pine Tree Dr
- 4798 E Stable Ln
- 3140 E Washington St
- 4990 Mile Hill Dr
- 2949 SE Mile Hill Dr Unit C-2
- 1200 Baby Doll Rd E
- 190 SE Mile Hill Dr
- 0 E Washington St Unit NWM2337936
- 22 Lots E Washington St
- 2085 Tidepool Place E
- 2086 Tidepool Place E
- 1125 Lidstrom Rd SE
- 2091 Tidepool Place E
- 1140 Lidstrom Rd SE
- 1140 Lidstrom Rd E
- 2092 Tidepool Place E
- 2098 Tidepool Place E
- 2097 Tidepool Place E
- 2104 Tidepool Place E
- 3949 SE Horstman Rd
- 2103 Tidepool Place E
- 2110 Tidepool Place E
- 3835 SE Horstman Rd
- 3815 SE Horstman Rd
- 4005 SE Horstman Rd
- 3849 SE Horstman Rd
- 1073 Lidstrom Rd E
- 2116 Tidepool Place E
- 2109 Tidepool Place E