Estimated Value: $475,000 - $564,000
5
Beds
2
Baths
1,680
Sq Ft
$299/Sq Ft
Est. Value
About This Home
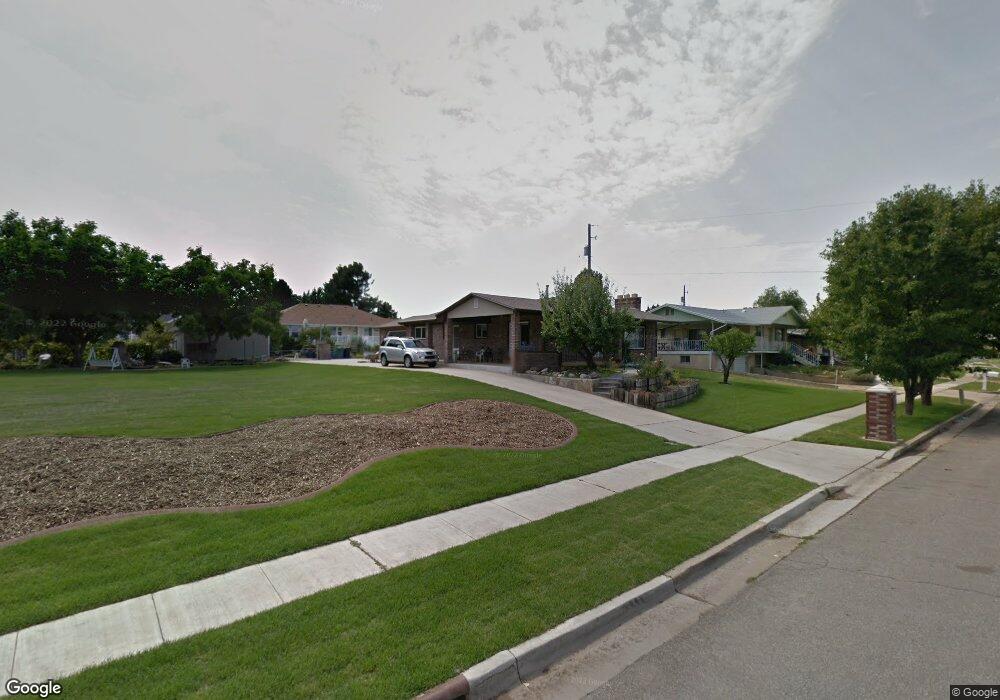
This home is located at 2079 W 4300 S, Roy, UT 84067 and is currently estimated at $502,018, approximately $298 per square foot. 2079 W 4300 S is a home located in Weber County with nearby schools including North Park School, Sand Ridge Junior High School, and Roy High School.
Ownership History
Date
Name
Owned For
Owner Type
Purchase Details
Closed on
Apr 22, 2024
Sold by
Ned & Pat Newman Family Trust and Newman Kelly
Bought by
Newman Kent Maurice and Newman Sharon A
Current Estimated Value
Home Financials for this Owner
Home Financials are based on the most recent Mortgage that was taken out on this home.
Original Mortgage
$359,900
Outstanding Balance
$354,523
Interest Rate
6.88%
Mortgage Type
New Conventional
Estimated Equity
$147,495
Create a Home Valuation Report for This Property
The Home Valuation Report is an in-depth analysis detailing your home's value as well as a comparison with similar homes in the area
Home Values in the Area
Average Home Value in this Area
Purchase History
| Date | Buyer | Sale Price | Title Company |
|---|---|---|---|
| Newman Kent Maurice | -- | First American Title |
Source: Public Records
Mortgage History
| Date | Status | Borrower | Loan Amount |
|---|---|---|---|
| Open | Newman Kent Maurice | $359,900 |
Source: Public Records
Tax History Compared to Growth
Tax History
| Year | Tax Paid | Tax Assessment Tax Assessment Total Assessment is a certain percentage of the fair market value that is determined by local assessors to be the total taxable value of land and additions on the property. | Land | Improvement |
|---|---|---|---|---|
| 2025 | $3,191 | $508,756 | $149,017 | $359,739 |
| 2024 | $3,115 | $300,849 | $81,969 | $218,880 |
| 2023 | $3,179 | $282,700 | $72,548 | $210,152 |
| 2022 | $3,099 | $281,600 | $61,202 | $220,398 |
| 2021 | $2,675 | $401,000 | $80,003 | $320,997 |
| 2020 | $2,501 | $344,000 | $80,003 | $263,997 |
| 2019 | $2,581 | $337,000 | $49,055 | $287,945 |
| 2018 | $2,527 | $312,000 | $45,975 | $266,025 |
| 2017 | $2,578 | $301,000 | $45,975 | $255,025 |
| 2016 | $2,308 | $144,189 | $20,133 | $124,056 |
| 2015 | $2,240 | $144,189 | $20,133 | $124,056 |
| 2014 | $2,259 | $144,189 | $20,133 | $124,056 |
Source: Public Records
Map
Nearby Homes
- 4328 S 2175 W
- 2082 W 4450 S
- 2015 W 4225 S
- 4220 S 2075 W
- 4205 S 2075 W
- 4475 S 1975 W
- 2263 W 4400 S
- 1825 W 4400 S
- 4536 S 1900 W Unit 12
- 2038 W 4600 S
- 2259 W 4525 S
- 4073 S 2175 W
- 4642 S 1900 W Unit 41
- 1825 W 4500 S Unit 101
- 4110 S 2275 W
- 4164 S 2400 W
- 2070 W 4000 S
- 2050 W 4000 S
- 1959 3985 St S Unit 2
- 1766 W 4575 S