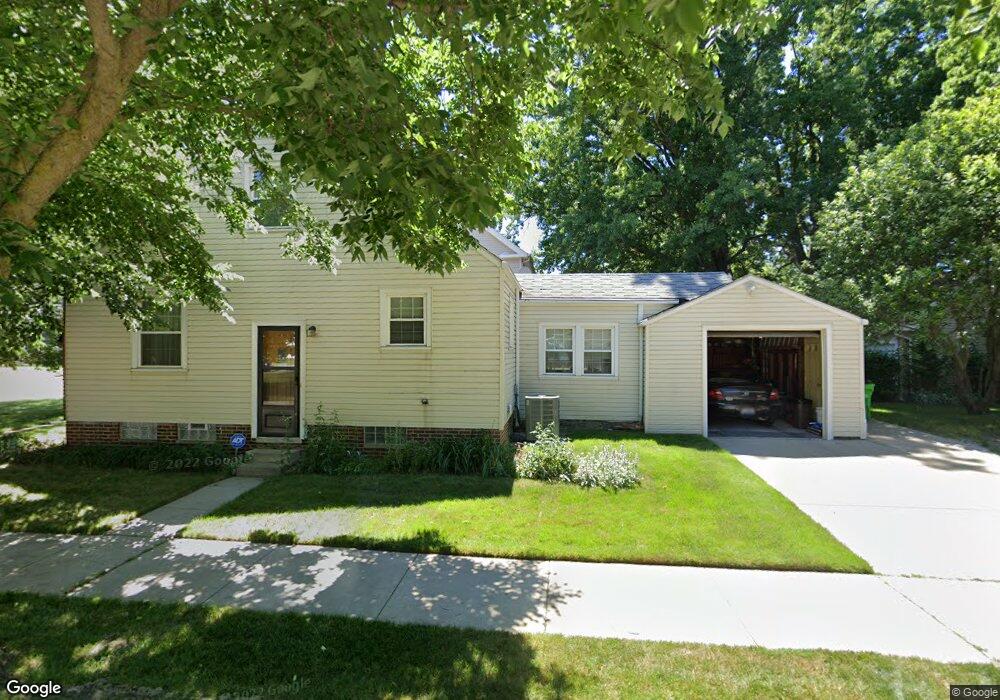
20791 Lake Shore Blvd Euclid, OH 44123
Estimated Value: $148,000 - $175,000
2
Beds
1
Bath
1,576
Sq Ft
$103/Sq Ft
Est. Value
About This Home
This home is located at 20791 Lake Shore Blvd, Euclid, OH 44123 and is currently estimated at $163,041, approximately $103 per square foot. 20791 Lake Shore Blvd is a home located in Cuyahoga County with nearby schools including Arbor Elementary School, Euclid Middle School, and Euclid High School.
Ownership History
Date
Name
Owned For
Owner Type
Purchase Details
Closed on
Jan 20, 2025
Sold by
Howell Sarita L and Howell David C
Bought by
Howell David C and Howell Sarita L
Current Estimated Value
Purchase Details
Closed on
Apr 27, 2016
Sold by
Howell David C and Howell Sarita L
Bought by
Howell David C and Howell Sarita L
Purchase Details
Closed on
Apr 30, 2008
Sold by
Howell David C and Howell Sarita L
Bought by
Howell David C
Purchase Details
Closed on
Feb 26, 2007
Sold by
Howell David C and Howell Sarita L
Bought by
Howell David C and Howell Sarita L
Purchase Details
Closed on
Jun 12, 1992
Sold by
Kouris Janet Helen
Bought by
Howell David C
Purchase Details
Closed on
Nov 25, 1987
Sold by
Kouris Helen
Bought by
Kouris Janet Helen
Purchase Details
Closed on
Jan 1, 1975
Bought by
Kouris Helen
Create a Home Valuation Report for This Property
The Home Valuation Report is an in-depth analysis detailing your home's value as well as a comparison with similar homes in the area
Home Values in the Area
Average Home Value in this Area
Purchase History
| Date | Buyer | Sale Price | Title Company |
|---|---|---|---|
| Howell David C | -- | None Listed On Document | |
| Howell David C | -- | Attorney | |
| Howell David C | -- | Attorney | |
| Howell David C | -- | Attorney | |
| Howell David C | $79,000 | -- | |
| Kouris Janet Helen | -- | -- | |
| Kouris Helen | -- | -- |
Source: Public Records
Tax History Compared to Growth
Tax History
| Year | Tax Paid | Tax Assessment Tax Assessment Total Assessment is a certain percentage of the fair market value that is determined by local assessors to be the total taxable value of land and additions on the property. | Land | Improvement |
|---|---|---|---|---|
| 2024 | $3,645 | $53,130 | $9,450 | $43,680 |
| 2023 | $3,577 | $41,730 | $9,280 | $32,450 |
| 2022 | $3,495 | $41,720 | $9,280 | $32,450 |
| 2021 | $3,901 | $41,720 | $9,280 | $32,450 |
| 2020 | $3,954 | $38,610 | $8,580 | $30,030 |
| 2019 | $3,559 | $110,300 | $24,500 | $85,800 |
| 2018 | $3,594 | $38,610 | $8,580 | $30,030 |
| 2017 | $3,770 | $33,820 | $7,320 | $26,500 |
| 2016 | $3,867 | $33,820 | $7,320 | $26,500 |
| 2015 | $3,561 | $33,820 | $7,320 | $26,500 |
| 2014 | $3,522 | $33,820 | $7,320 | $26,500 |
Source: Public Records
Map
Nearby Homes
- 144 E 208th St
- 273 E 208th St
- 231 E 210th St
- 121 E 205th St
- 20249 Lake Shore Blvd
- 20207 Lake Shore Blvd
- 174 E 212th St
- 254 E 214th St
- 362 E 214th St
- 21051 S Lake Shore Blvd
- 20330 S Lake Shore Blvd
- 21251 S Lake Shore Blvd
- 174 E 200th St
- 290 E 216th St
- 21561 Maydale Ave
- 226 E 216th St
- 275 E 200th St
- 21030 Priday Ave
- 19751 Lake Shore Blvd
- 22000 Kennison Ave
- 20771 Lake Shore Blvd
- 20751 Lake Shore Blvd
- 20831 Lakeshore Blvd
- 20831 Lake Shore Blvd
- 20851 Lake Shore Blvd
- 20731 Lake Shore Blvd
- 172 E 208th St
- 175 E 208th St
- 170 E 208th St
- 20861 Lake Shore Blvd
- 171 E 208th St
- 175 E 207th St
- 20711 Lake Shore Blvd
- 164 E 208th St
- 20810 Lake Shore Blvd
- 167 E 208th St
- 171 E 207th St
- 20871 Lake Shore Blvd
- 165 E 208th St
- 156 E 208th St