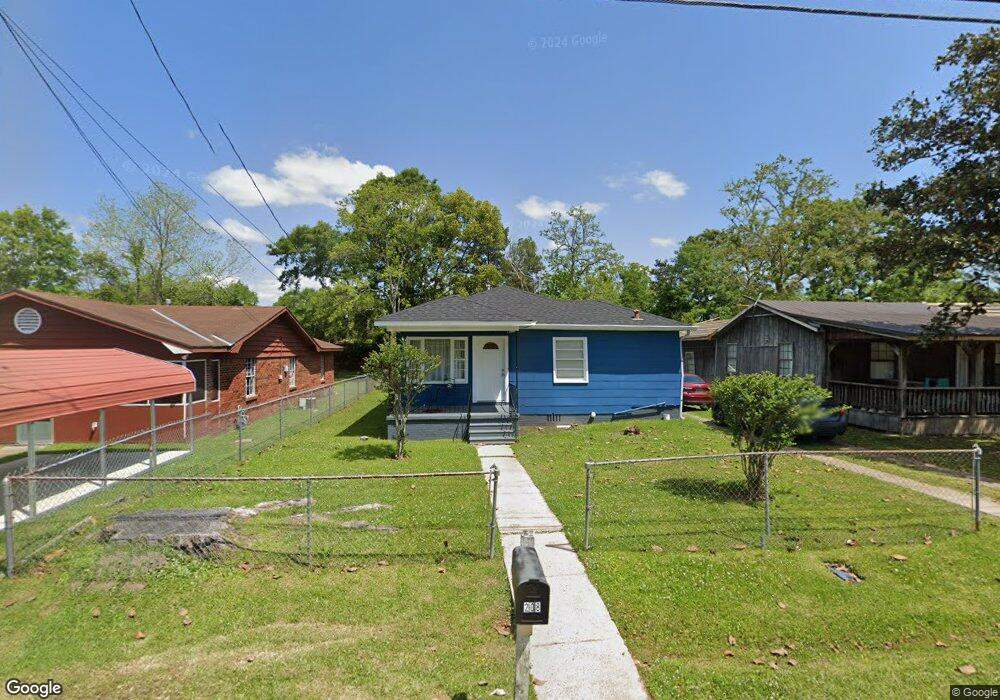
208 12th Ave Mobile, AL 36611
Estimated Value: $65,000 - $83,835
3
Beds
1
Bath
1,125
Sq Ft
$68/Sq Ft
Est. Value
About This Home
This home is located at 208 12th Ave, Mobile, AL 36611 and is currently estimated at $75,959, approximately $67 per square foot. 208 12th Ave is a home located in Mobile County with nearby schools including Chickasaw City Elementary School, Chickasaw City High School, and Prichard Preparatory School.
Ownership History
Date
Name
Owned For
Owner Type
Purchase Details
Closed on
Nov 29, 2022
Sold by
Fairley Dorothy M
Bought by
Harris Conrad J and Duff Adrianne L
Current Estimated Value
Home Financials for this Owner
Home Financials are based on the most recent Mortgage that was taken out on this home.
Original Mortgage
$54,000
Outstanding Balance
$52,216
Interest Rate
6.95%
Mortgage Type
New Conventional
Estimated Equity
$23,743
Purchase Details
Closed on
May 28, 1999
Sold by
Bradley David R
Bought by
Fairley Dorothy M
Home Financials for this Owner
Home Financials are based on the most recent Mortgage that was taken out on this home.
Original Mortgage
$39,882
Interest Rate
6.9%
Mortgage Type
FHA
Purchase Details
Closed on
Dec 7, 1998
Sold by
Spurlock Michael Steven and Spurlock Louise Oquinn
Bought by
Bradley David R
Purchase Details
Closed on
Nov 23, 1998
Sold by
Spurlock Michael
Bought by
Jordan William J
Create a Home Valuation Report for This Property
The Home Valuation Report is an in-depth analysis detailing your home's value as well as a comparison with similar homes in the area
Home Values in the Area
Average Home Value in this Area
Purchase History
We collect this data history from publicly available records. To have your information removed, we recommend requesting removal directly through your county’s website.
| Date | Buyer | Sale Price | Title Company |
|---|---|---|---|
| Harris Conrad J | $72,000 | None Listed On Document | |
| Fairley Dorothy M | -- | -- | |
| Bradley David R | -- | -- | |
| Jordan William J | $5,460 | -- |
Source: Public Records
Mortgage History
We collect this data history from publicly available records. To have your information removed, we recommend requesting removal directly through your county’s website.
| Date | Status | Borrower | Loan Amount |
|---|---|---|---|
| Open | Harris Conrad J | $54,000 | |
| Previous Owner | Fairley Dorothy M | $39,882 |
Source: Public Records
Tax History
| Year | Tax Paid | Tax Assessment Tax Assessment Total Assessment is a certain percentage of the fair market value that is determined by local assessors to be the total taxable value of land and additions on the property. | Land | Improvement |
|---|---|---|---|---|
| 2025 | $807 | $14,100 | $1,200 | $12,900 |
| 2024 | $807 | $13,320 | $1,200 | $12,120 |
| 2023 | $723 | $7,080 | $1,200 | $5,880 |
| 2022 | $0 | $3,270 | $600 | $2,670 |
| 2021 | $0 | $3,000 | $550 | $2,450 |
| 2020 | $0 | $3,000 | $550 | $2,450 |
| 2019 | $0 | $5,520 | $1,120 | $4,400 |
| 2018 | $0 | $2,740 | $0 | $0 |
| 2017 | $0 | $2,740 | $0 | $0 |
| 2016 | -- | $4,280 | $0 | $0 |
| 2013 | $198 | $4,660 | $0 | $0 |
Source: Public Records
Map
Nearby Homes
Your Personal Tour Guide
Ask me questions while you tour the home.