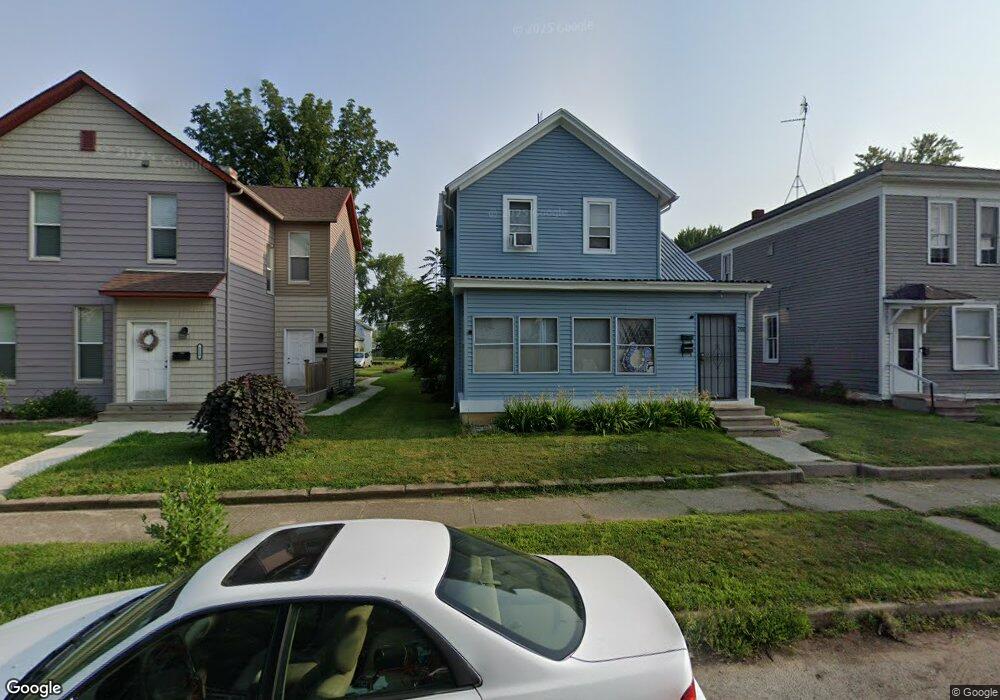
208 3rd St Fort Wayne, IN 46808
Bloomingdale NeighborhoodEstimated Value: $130,000 - $172,000
4
Beds
2
Baths
3,294
Sq Ft
$48/Sq Ft
Est. Value
About This Home
This home is located at 208 3rd St, Fort Wayne, IN 46808 and is currently estimated at $158,651, approximately $48 per square foot. 208 3rd St is a home located in Allen County with nearby schools including Bloomingdale Elementary School, Lakeside Middle School, and North Side High School.
Ownership History
Date
Name
Owned For
Owner Type
Purchase Details
Closed on
Jan 9, 2015
Sold by
Arnett Brittany
Bought by
Arnett Dawn M
Current Estimated Value
Purchase Details
Closed on
Oct 17, 2014
Sold by
Arnett Brittany
Bought by
Arnett Brittany
Purchase Details
Closed on
Jun 8, 2010
Sold by
Federal National Mortgage Association
Bought by
Arnett Daniel
Purchase Details
Closed on
Feb 2, 2010
Sold by
Panyard Joseph W and Panyard Penny S
Bought by
Federal National Mortgage Association
Create a Home Valuation Report for This Property
The Home Valuation Report is an in-depth analysis detailing your home's value as well as a comparison with similar homes in the area
Home Values in the Area
Average Home Value in this Area
Purchase History
| Date | Buyer | Sale Price | Title Company |
|---|---|---|---|
| Arnett Dawn M | -- | None Available | |
| Arnett Brittany | -- | None Available | |
| Arnett Daniel | -- | None Available | |
| Federal National Mortgage Association | $49,651 | None Available |
Source: Public Records
Tax History Compared to Growth
Tax History
| Year | Tax Paid | Tax Assessment Tax Assessment Total Assessment is a certain percentage of the fair market value that is determined by local assessors to be the total taxable value of land and additions on the property. | Land | Improvement |
|---|---|---|---|---|
| 2024 | $659 | $128,500 | $16,700 | $111,800 |
| 2023 | $1,319 | $101,300 | $16,700 | $84,600 |
| 2022 | $1,086 | $78,900 | $8,700 | $70,200 |
| 2021 | $953 | $68,800 | $8,700 | $60,100 |
| 2020 | $944 | $68,800 | $8,700 | $60,100 |
| 2019 | $1,173 | $83,800 | $8,700 | $75,100 |
| 2018 | $1,014 | $72,300 | $8,700 | $63,600 |
| 2017 | $836 | $59,300 | $8,700 | $50,600 |
| 2016 | $728 | $52,600 | $8,700 | $43,900 |
| 2014 | $671 | $32,300 | $5,700 | $26,600 |
| 2013 | $872 | $42,000 | $8,700 | $33,300 |
Source: Public Records
Map
Nearby Homes