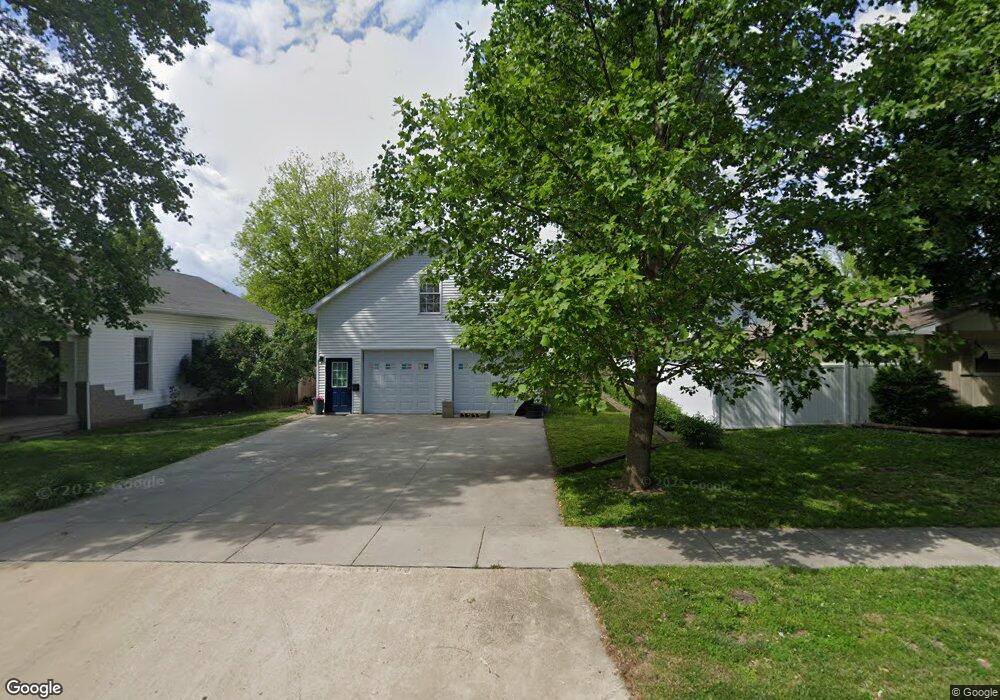
208 3rd St Lincoln, IL 62656
Estimated Value: $70,000 - $131,000
Studio
--
Bath
896
Sq Ft
$117/Sq Ft
Est. Value
About This Home
This home is located at 208 3rd St, Lincoln, IL 62656 and is currently estimated at $105,250, approximately $117 per square foot. 208 3rd St is a home with nearby schools including Central Elementary School, Lincoln Junior High School, and Lincoln Community High School.
Ownership History
Date
Name
Owned For
Owner Type
Purchase Details
Closed on
Aug 1, 2025
Sold by
Holloway Michelle Renee
Bought by
Mercier Michael Edward and Mercier Andrea Dawn
Current Estimated Value
Home Financials for this Owner
Home Financials are based on the most recent Mortgage that was taken out on this home.
Original Mortgage
$144,000
Outstanding Balance
$143,876
Interest Rate
6.75%
Mortgage Type
New Conventional
Estimated Equity
-$38,626
Purchase Details
Closed on
Feb 24, 2017
Sold by
Aper Timothy Lee
Bought by
Aper Michelle Renee
Home Financials for this Owner
Home Financials are based on the most recent Mortgage that was taken out on this home.
Original Mortgage
$52,000
Interest Rate
4.25%
Mortgage Type
New Conventional
Purchase Details
Closed on
Jul 14, 2006
Sold by
Aper Timothy L and Aper Michelle R
Bought by
Aper Timothy L and Aper Michelle R
Create a Home Valuation Report for This Property
The Home Valuation Report is an in-depth analysis detailing your home's value as well as a comparison with similar homes in the area
Home Values in the Area
Average Home Value in this Area
Purchase History
| Date | Buyer | Sale Price | Title Company |
|---|---|---|---|
| Mercier Michael Edward | $239,000 | None Available | |
| Aper Michelle Renee | -- | -- | |
| Aper Timothy L | $7,000 | -- |
Source: Public Records
Mortgage History
| Date | Status | Borrower | Loan Amount |
|---|---|---|---|
| Open | Mercier Michael Edward | $144,000 | |
| Previous Owner | Aper Michelle Renee | $52,000 |
Source: Public Records
Tax History
| Year | Tax Paid | Tax Assessment Tax Assessment Total Assessment is a certain percentage of the fair market value that is determined by local assessors to be the total taxable value of land and additions on the property. | Land | Improvement |
|---|---|---|---|---|
| 2024 | $2,378 | $26,290 | $5,370 | $20,920 |
| 2023 | $2,270 | $24,340 | $4,970 | $19,370 |
| 2022 | $2,207 | $22,690 | $4,630 | $18,060 |
| 2021 | $2,132 | $21,850 | $4,460 | $17,390 |
| 2020 | $2,136 | $21,850 | $4,460 | $17,390 |
| 2019 | $2,091 | $21,420 | $4,370 | $17,050 |
| 2018 | $2,036 | $20,590 | $4,200 | $16,390 |
| 2017 | $2,025 | $20,590 | $4,200 | $16,390 |
| 2016 | $1,998 | $20,830 | $4,250 | $16,580 |
| 2015 | $384 | $20,080 | $4,100 | $15,980 |
| 2014 | $384 | $20,080 | $4,100 | $15,980 |
| 2013 | $384 | $18,530 | $3,780 | $14,750 |
| 2012 | $384 | $3,840 | $3,840 | $0 |
Source: Public Records
Map
Nearby Homes
Your Personal Tour Guide
Ask me questions while you tour the home.