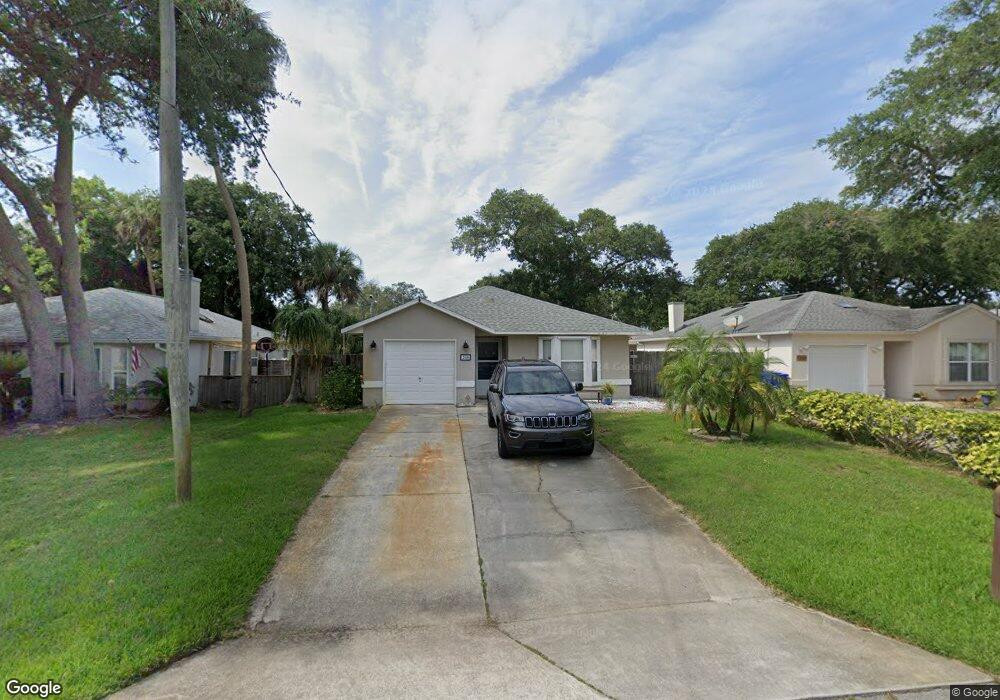
208 3rd St Saint Augustine, FL 32080
Estimated Value: $543,425 - $724,000
Studio
--
Bath
1,202
Sq Ft
$529/Sq Ft
Est. Value
About This Home
This home is located at 208 3rd St, Saint Augustine, FL 32080 and is currently estimated at $635,606, approximately $528 per square foot. 208 3rd St is a home located in St. Johns County with nearby schools including R.B. Hunt Elementary School, Sebastian Middle School, and St. Augustine High School.
Ownership History
Date
Name
Owned For
Owner Type
Purchase Details
Closed on
Jun 6, 2003
Sold by
Harmon Harold Douglas and Harmon Harold Douglas
Bought by
Harmon Brian Scott
Current Estimated Value
Home Financials for this Owner
Home Financials are based on the most recent Mortgage that was taken out on this home.
Original Mortgage
$170,100
Outstanding Balance
$62,787
Interest Rate
3.62%
Mortgage Type
Purchase Money Mortgage
Estimated Equity
$572,819
Purchase Details
Closed on
Apr 18, 2001
Sold by
Harmon Gwen B and Harmon Harold D
Bought by
Harmon Harold Douglas
Purchase Details
Closed on
Dec 30, 1999
Sold by
Lap P J Bv
Bought by
Harmon Harold D and Harmon Gwen B
Home Financials for this Owner
Home Financials are based on the most recent Mortgage that was taken out on this home.
Original Mortgage
$92,000
Interest Rate
7.68%
Create a Home Valuation Report for This Property
The Home Valuation Report is an in-depth analysis detailing your home's value as well as a comparison with similar homes in the area
Home Values in the Area
Average Home Value in this Area
Purchase History
| Date | Buyer | Sale Price | Title Company |
|---|---|---|---|
| Harmon Brian Scott | $189,000 | -- | |
| Harmon Harold Douglas | -- | -- | |
| Harmon Harold D | $115,000 | Independent Title St Augusti |
Source: Public Records
Mortgage History
| Date | Status | Borrower | Loan Amount |
|---|---|---|---|
| Open | Harmon Brian Scott | $170,100 | |
| Closed | Harmon Harold D | $92,000 |
Source: Public Records
Tax History
| Year | Tax Paid | Tax Assessment Tax Assessment Total Assessment is a certain percentage of the fair market value that is determined by local assessors to be the total taxable value of land and additions on the property. | Land | Improvement |
|---|---|---|---|---|
| 2025 | $6,340 | $403,115 | -- | -- |
| 2024 | $6,340 | $531,905 | $292,540 | $239,365 |
| 2023 | $6,340 | $485,440 | $255,040 | $230,400 |
| 2022 | $5,745 | $416,414 | $198,790 | $217,624 |
| 2021 | $4,767 | $275,333 | $0 | $0 |
| 2020 | $4,503 | $276,685 | $0 | $0 |
| 2019 | $4,153 | $252,229 | $0 | $0 |
| 2018 | $3,972 | $253,452 | $0 | $0 |
| 2017 | $3,719 | $236,228 | $129,500 | $106,728 |
| 2016 | $3,402 | $194,014 | $0 | $0 |
| 2015 | $3,126 | $176,376 | $0 | $0 |
| 2014 | $2,671 | $144,758 | $0 | $0 |
Source: Public Records
Map
Nearby Homes
Your Personal Tour Guide
Ask me questions while you tour the home.