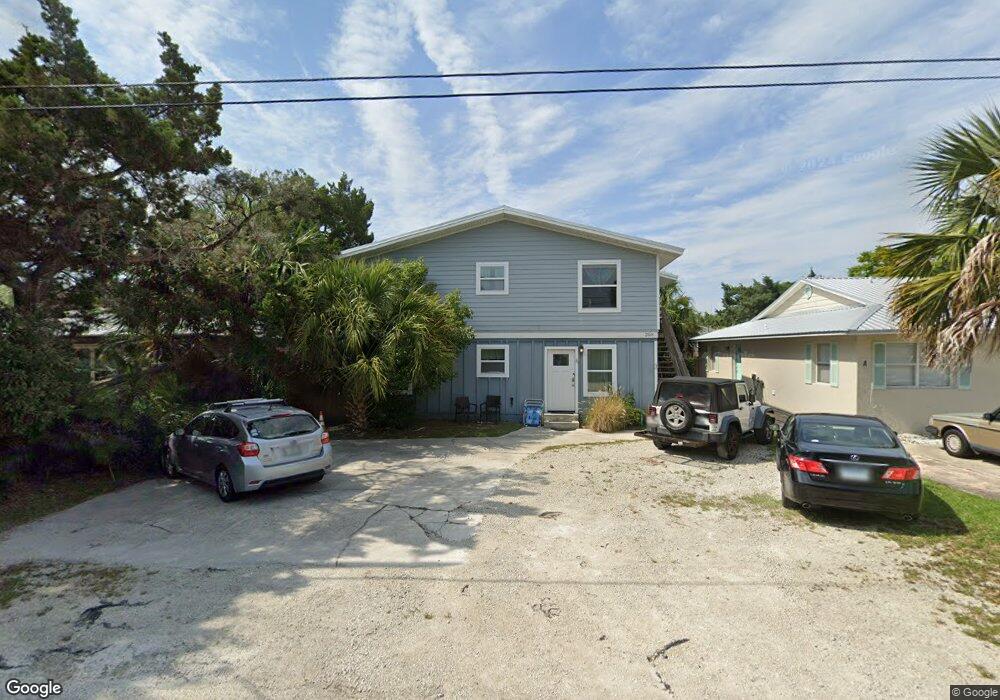
208 9th St Unit A Saint Augustine, FL 32080
Estimated Value: $718,865 - $1,139,000
6
Beds
2
Baths
2,048
Sq Ft
$416/Sq Ft
Est. Value
About This Home
This home is located at 208 9th St Unit A, Saint Augustine, FL 32080 and is currently estimated at $851,966, approximately $415 per square foot. 208 9th St Unit A is a home located in St. Johns County with nearby schools including R.B. Hunt Elementary School, Sebastian Middle School, and St. Augustine High School.
Ownership History
Date
Name
Owned For
Owner Type
Purchase Details
Closed on
Aug 21, 2023
Sold by
Manis Tsambika
Bought by
Kopros Llc
Current Estimated Value
Purchase Details
Closed on
Aug 24, 2020
Sold by
Maguire Lindsay Skye and Dellasala Donald
Bought by
Manis Tsambika
Purchase Details
Closed on
Feb 8, 2018
Sold by
Harmens Tim C and Harmens Karen L
Bought by
Maguier Lindsey Skye and Dellasala Donald
Home Financials for this Owner
Home Financials are based on the most recent Mortgage that was taken out on this home.
Original Mortgage
$221,250
Interest Rate
4.15%
Mortgage Type
New Conventional
Purchase Details
Closed on
Dec 28, 2001
Sold by
Millecan Roger P and Millecan Kathleen A
Bought by
Harmsen Tim C and Harmsen Karen L
Home Financials for this Owner
Home Financials are based on the most recent Mortgage that was taken out on this home.
Original Mortgage
$166,500
Interest Rate
6.72%
Mortgage Type
Commercial
Create a Home Valuation Report for This Property
The Home Valuation Report is an in-depth analysis detailing your home's value as well as a comparison with similar homes in the area
Home Values in the Area
Average Home Value in this Area
Purchase History
| Date | Buyer | Sale Price | Title Company |
|---|---|---|---|
| Kopros Llc | $100 | Southern Cape Title | |
| Bika Beach Llc | $100 | Southern Cape Title | |
| Manis Tsambika | $530,000 | Fidelity Natl Ttl Of Fl Inc | |
| Maguier Lindsey Skye | $295,000 | Paradise Title Of St Augusti | |
| Harmsen Tim C | $185,000 | -- |
Source: Public Records
Mortgage History
| Date | Status | Borrower | Loan Amount |
|---|---|---|---|
| Previous Owner | Maguier Lindsey Skye | $221,250 | |
| Previous Owner | Harmsen Tim C | $166,500 |
Source: Public Records
Tax History
| Year | Tax Paid | Tax Assessment Tax Assessment Total Assessment is a certain percentage of the fair market value that is determined by local assessors to be the total taxable value of land and additions on the property. | Land | Improvement |
|---|---|---|---|---|
| 2025 | $9,022 | $618,670 | $292,540 | $326,130 |
| 2024 | $9,022 | $608,208 | $292,540 | $315,668 |
| 2023 | $9,022 | $578,135 | $255,040 | $323,095 |
| 2022 | $8,478 | $542,513 | $198,790 | $343,723 |
| 2021 | $7,511 | $425,621 | $0 | $0 |
| 2020 | $5,306 | $339,986 | $0 | $0 |
| 2019 | $4,328 | $255,783 | $0 | $0 |
| 2018 | $3,607 | $225,961 | $0 | $0 |
| 2017 | $3,501 | $208,085 | $129,500 | $78,585 |
| 2016 | $3,185 | $179,586 | $0 | $0 |
Source: Public Records
Map
Nearby Homes
- 208 9th St
- 210 9th St
- 206 9th St
- 204 9th St
- 212 9th St
- 207 10th St
- 205 10th St
- 209 10th St
- 209 10th St
- 207 9th St Unit B
- 207 9th St
- 207A 9th St Unit 1
- 207A 9th St
- 207 9th St - Furnished (St Aug Bch)
- 207 9th Street - Upstairs Unit Unit B
- 209 9th St
- 209 9th St Unit B (upstairs)
- 205 9th St
- 205 9th St Unit B
- 211 10th St
Your Personal Tour Guide
Ask me questions while you tour the home.