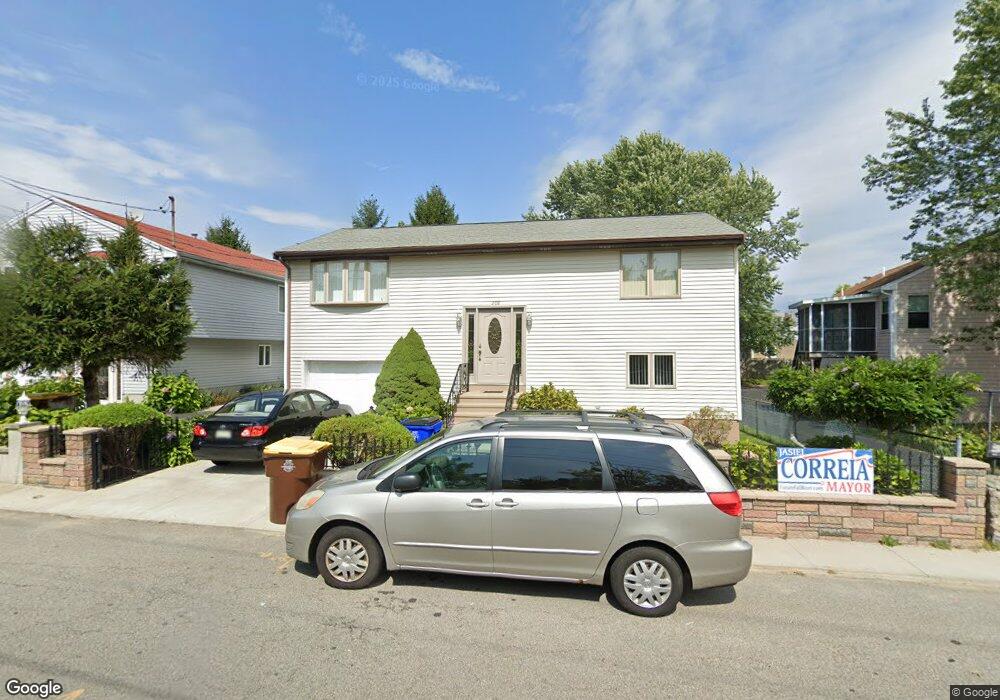
208 Amity St Fall River, MA 02721
Maplewood NeighborhoodEstimated Value: $351,000 - $435,000
2
Beds
2
Baths
1,296
Sq Ft
$309/Sq Ft
Est. Value
About This Home
This home is located at 208 Amity St, Fall River, MA 02721 and is currently estimated at $400,203, approximately $308 per square foot. 208 Amity St is a home located in Bristol County with nearby schools including Henry Lord Community School, B M C Durfee High School, and Argosy Collegiate Charter School.
Ownership History
Date
Name
Owned For
Owner Type
Purchase Details
Closed on
Jul 22, 2014
Sold by
Aguiar Francisco and Aguiar Eduarda
Bought by
Aguiar Irt
Current Estimated Value
Purchase Details
Closed on
Nov 25, 1991
Sold by
Cook Pond R & D Rt
Bought by
Aguiar Francisco and Aguiar Eduarda
Home Financials for this Owner
Home Financials are based on the most recent Mortgage that was taken out on this home.
Original Mortgage
$50,000
Interest Rate
8.7%
Mortgage Type
Purchase Money Mortgage
Create a Home Valuation Report for This Property
The Home Valuation Report is an in-depth analysis detailing your home's value as well as a comparison with similar homes in the area
Home Values in the Area
Average Home Value in this Area
Purchase History
| Date | Buyer | Sale Price | Title Company |
|---|---|---|---|
| Aguiar Irt | -- | -- | |
| Aguiar Francisco | $37,000 | -- |
Source: Public Records
Mortgage History
| Date | Status | Borrower | Loan Amount |
|---|---|---|---|
| Previous Owner | Aguiar Francisco | $50,000 |
Source: Public Records
Tax History
| Year | Tax Paid | Tax Assessment Tax Assessment Total Assessment is a certain percentage of the fair market value that is determined by local assessors to be the total taxable value of land and additions on the property. | Land | Improvement |
|---|---|---|---|---|
| 2025 | $4,033 | $352,200 | $123,700 | $228,500 |
| 2024 | $3,734 | $325,000 | $119,100 | $205,900 |
| 2023 | $3,680 | $299,900 | $102,100 | $197,800 |
| 2022 | $3,197 | $253,600 | $92,800 | $160,800 |
| 2021 | $3,197 | $231,200 | $85,900 | $145,300 |
| 2020 | $3,115 | $215,600 | $82,200 | $133,400 |
| 2019 | $3,087 | $211,700 | $78,300 | $133,400 |
| 2018 | $2,943 | $201,300 | $76,800 | $124,500 |
| 2017 | $2,827 | $201,900 | $78,400 | $123,500 |
| 2016 | $2,712 | $199,000 | $81,600 | $117,400 |
| 2015 | $2,432 | $185,900 | $78,600 | $107,300 |
| 2014 | $2,390 | $190,000 | $82,700 | $107,300 |
Source: Public Records
Map
Nearby Homes
- 198 Amity St
- 751 Laurel St
- 190 Amity St
- 729 Laurel St
- 729 Laurel St Unit 1
- 50 Pondview Dr
- 804 Laurel St
- 170 Amity St
- 707 Laurel St
- 47 Pondview Dr
- 7 Newton St
- 158 Amity St
- 726 Laurel St
- 249 Amity St
- 35 Pondview Dr
- 35 Pondview Dr
- 146 Amity St
- 305 Newton St Unit 3
- 305 Newton St Unit 8
- 305 Newton St Unit 12
Your Personal Tour Guide
Ask me questions while you tour the home.