208 Antiock Ct Belleville, IL 62221
Estimated Value: $394,000 - $442,000
--
Bed
--
Bath
1,518
Sq Ft
$278/Sq Ft
Est. Value
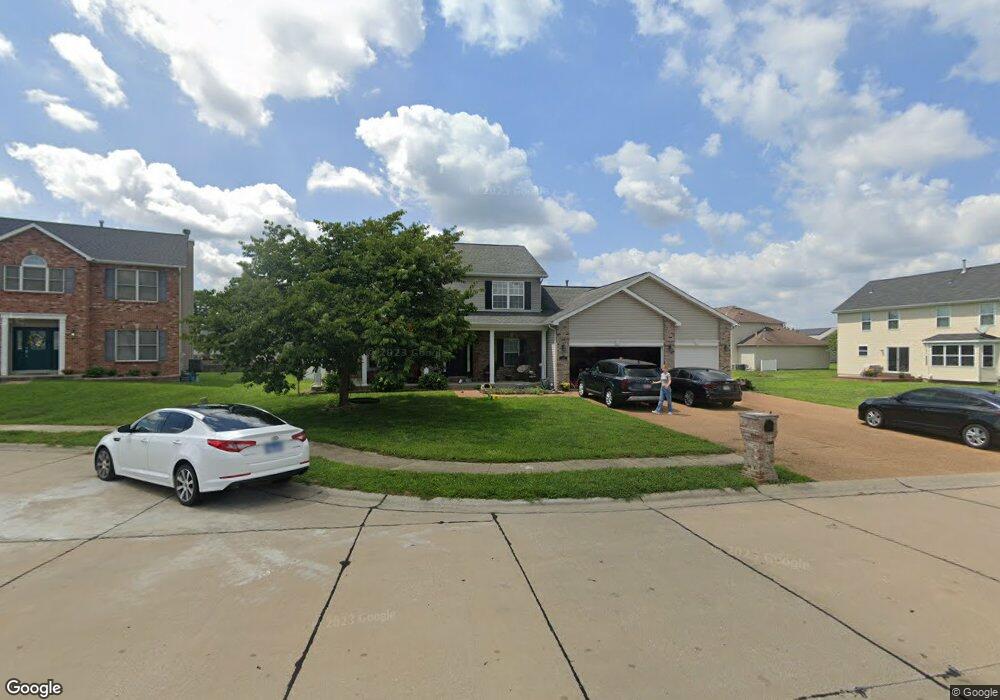
About This Home
This home is located at 208 Antiock Ct, Belleville, IL 62221 and is currently estimated at $421,438, approximately $277 per square foot. 208 Antiock Ct is a home located in St. Clair County with nearby schools including Shiloh Elementary School, Shiloh Middle School, and O'Fallon Township High School.
Ownership History
Date
Name
Owned For
Owner Type
Purchase Details
Closed on
Jan 21, 2020
Sold by
Barber Lisa
Bought by
Barber Christopher
Current Estimated Value
Home Financials for this Owner
Home Financials are based on the most recent Mortgage that was taken out on this home.
Original Mortgage
$210,000
Outstanding Balance
$185,900
Interest Rate
3.7%
Mortgage Type
New Conventional
Estimated Equity
$235,538
Purchase Details
Closed on
Dec 21, 2010
Sold by
Stillwater Corporation
Bought by
Barber Christopher P and Barber Lisa M
Home Financials for this Owner
Home Financials are based on the most recent Mortgage that was taken out on this home.
Original Mortgage
$254,571
Interest Rate
4.16%
Mortgage Type
FHA
Purchase Details
Closed on
Aug 6, 2010
Sold by
Whittaker Builders Inc
Bought by
Stillwater Corporation and Antiock Trust #208
Create a Home Valuation Report for This Property
The Home Valuation Report is an in-depth analysis detailing your home's value as well as a comparison with similar homes in the area
Home Values in the Area
Average Home Value in this Area
Purchase History
| Date | Buyer | Sale Price | Title Company |
|---|---|---|---|
| Barber Christopher | -- | Community Title Shiloh Llc | |
| Barber Christopher P | $258,000 | Community Title Shiloh Llc | |
| Stillwater Corporation | $37,000 | Benchmark Title Company |
Source: Public Records
Mortgage History
| Date | Status | Borrower | Loan Amount |
|---|---|---|---|
| Open | Barber Christopher | $210,000 | |
| Closed | Barber Christopher P | $254,571 |
Source: Public Records
Tax History Compared to Growth
Tax History
| Year | Tax Paid | Tax Assessment Tax Assessment Total Assessment is a certain percentage of the fair market value that is determined by local assessors to be the total taxable value of land and additions on the property. | Land | Improvement |
|---|---|---|---|---|
| 2024 | $8,320 | $118,222 | $20,254 | $97,968 |
| 2023 | $7,842 | $109,392 | $19,658 | $89,734 |
| 2022 | $7,432 | $101,043 | $18,310 | $82,733 |
| 2021 | $6,874 | $94,475 | $17,219 | $77,256 |
| 2020 | $7,081 | $89,166 | $16,251 | $72,915 |
| 2019 | $6,666 | $85,878 | $16,880 | $68,998 |
| 2018 | $6,536 | $83,425 | $16,398 | $67,027 |
| 2017 | $6,324 | $79,508 | $15,628 | $63,880 |
| 2016 | $6,274 | $77,995 | $15,331 | $62,664 |
| 2014 | $5,823 | $78,570 | $16,195 | $62,375 |
| 2013 | $29 | $79,629 | $16,413 | $63,216 |
Source: Public Records
Map
Nearby Homes
- 3536 Harbor Way
- 3533 Capri Ln
- xxxx Chippewa Dr
- 3424 Navajo Trail
- Brady Plan at Indian Springs - Indian Spring
- Winchester B Plan at Indian Springs - Indian Spring
- Alexandria Plan at Indian Springs - Indian Spring
- Hannah Plan at Indian Springs - Indian Spring
- Culpepper Plan at Indian Springs - Indian Spring
- Bristol Villa Plan at Indian Springs - Indian Spring
- Bristol Plan at Indian Springs - Indian Spring
- Covington 2 Car Plan at Indian Springs - Indian Spring
- Winchester A Plan at Indian Springs - Indian Spring
- Sunrise Plan at Indian Springs - Indian Spring
- Bella Plan at Indian Springs - Indian Spring
- Covington Plan at Indian Springs - Indian Spring
- Titan Plan at Indian Springs - Indian Spring
- Herndon Plan at Indian Springs - Indian Spring
- Scarlett Plan at Indian Springs - Indian Spring
- 3700 Osprey Ct