
Seller's Agent in 2025
Ashlyn Cousins
BHHS C Dan Joyner - Midtown
(864) 363-5713
10 in this area
71 Total Sales

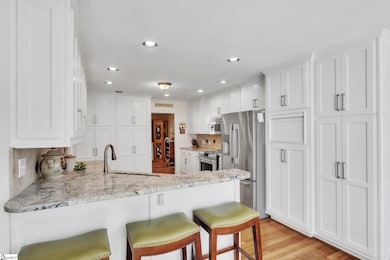

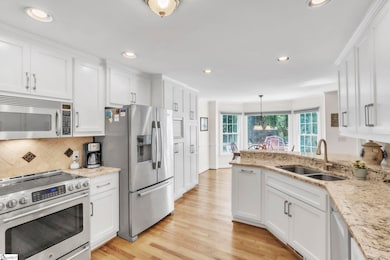
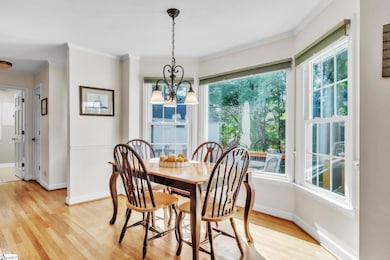
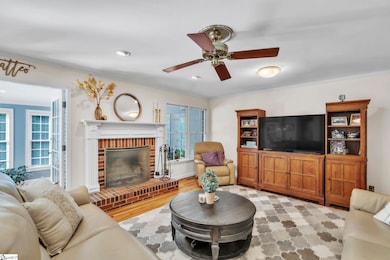

JUST REDUCED $20K BELOW APPRAISAL! The SUGAR CREEK Estate you’ve been looking for! This all-brick beauty is a GEM. Customized and built by local builder Graham Proffitt for his personal home, this property is unlike any other in sought-after Sugar Creek III. Super floor plan with a FULL BEDROOM AND BATHROOM SUITE ON MAIN LEVEL. Formal living room, dining, den and SUNROOM with wet bar, perfect for entertaining! REMODELED KITCHEN is a chef’s delight! Storage everywhere, walk-in pantry with coffee station, stainless appliances and granite counters. Gleaming hardwoods and neutral paint throughout the first floor living areas. Choose from one of the TWO STAIRCASES to head up to the upstairs. You’ll find the primary suite that includes a sitting area, spa-like primary bath and attached generous walk-in closet. Two more bedrooms on this level share a jack & jill bath. A 5th bedroom is currently being used an office with a wall of built-in shelving and desk space! Super-sized REC/FLEX SPACE has built-in desk, multiple closets. STORAGE GALORE! Two walk-in storage closets on the second floor in addition to attic storage, garage storage and outdoor storage shed! Got cars? The current owner built an ADDITIONAL DETACHED 2+ GARAGE that is heated & cooled, perfect for your projects or additional parking! Between both garages, you’ll have garage space for 4+ cars along with workshop area! Extra parking pad makes turnarounds and space for guests a breeze. Enjoy outdoor living at its finest on the spacious back sunning deck, built with long-lasting composite decking! Some updates to the home include: Roof replaced, new gutters & new vinyl windows throughout in 2017, new deck with trex decking, new detached garage 2020, new hot water heaters 2022, kitchen remodel, new driveway & sidewalk, landscape improvements 2023. Ready for some OUTDOOR FUN? You’re just a skip to the pickleball/tennis courts and a hop to the neighborhood pool! No other lot in the neighborhood is closer to these amenities, yet keeps its peace and quiet with private spaces. Sugar Creek is a neighborhood legend in our area! Families of all types & sizes seek out Sugar Creek for resort-style amenities, community activities, walkable streets and highly rated Riverside school district. No wonder it’s not easy to find homes available here because it’s hard to find Sugar Creek owners who are willing to move! Don’t miss this opportunity to own a SPECIAL property in a SPECIAL neighborhood, priced to sell today!
Last Agent to Sell the Property
BHHS C Dan Joyner - Midtown License #90066 Listed on: 10/22/2025
| Date | Type | Sale Price | Title Company |
|---|---|---|---|
| Warranty Deed | $780,000 | None Listed On Document | |
| Warranty Deed | $342,000 | -- | |
| Interfamily Deed Transfer | -- | None Available | |
| Deed | $268,000 | -- |
| Date | Status | Loan Amount | Loan Type |
|---|---|---|---|
| Open | $741,000 | New Conventional | |
| Previous Owner | $342,000 | VA | |
| Previous Owner | $292,000 | New Conventional |
| Date | Event | Price | List to Sale | Price per Sq Ft |
|---|---|---|---|---|
| 12/12/2025 12/12/25 | Sold | $780,000 | -1.9% | $195 / Sq Ft |
| 11/07/2025 11/07/25 | Price Changed | $795,000 | -2.5% | $199 / Sq Ft |
| 10/22/2025 10/22/25 | For Sale | $815,000 | -- | $204 / Sq Ft |
| Year | Tax Paid | Tax Assessment Tax Assessment Total Assessment is a certain percentage of the fair market value that is determined by local assessors to be the total taxable value of land and additions on the property. | Land | Improvement |
|---|---|---|---|---|
| 2025 | $3,017 | $21,080 | $3,500 | $17,580 |
| 2024 | $3,017 | $18,330 | $1,980 | $16,350 |
| 2023 | $2,900 | $18,330 | $1,980 | $16,350 |
| 2022 | $2,676 | $18,330 | $1,980 | $16,350 |
| 2021 | $2,678 | $18,330 | $1,980 | $16,350 |
| 2020 | $2,830 | $18,330 | $1,980 | $16,350 |
| 2019 | $2,085 | $13,710 | $1,600 | $12,110 |
| 2018 | $2,220 | $13,710 | $1,600 | $12,110 |
| 2017 | $2,199 | $13,710 | $1,600 | $12,110 |
| 2016 | $2,100 | $342,680 | $40,000 | $302,680 |
| 2015 | $2,073 | $342,680 | $40,000 | $302,680 |
| 2014 | $2,053 | $341,120 | $40,000 | $301,120 |
Seller's Agent in 2025
Ashlyn Cousins
BHHS C Dan Joyner - Midtown
(864) 363-5713
10 in this area
71 Total Sales
Buyer's Agent in 2025
Haley Michael
BHHS C Dan Joyner - Midtown
(864) 640-9633
33 in this area
109 Total Sales
Source: Greater Greenville Association of REALTORS®
MLS Number: 1572920
APN: 0534.11-01-133.00
Disclaimer: Certain information contained herein is derived from information provided by parties other than Homes.com. All information provided is deemed reliable, but is not guaranteed to be accurate and should be independently verified.
![]() IDX information is provided exclusively for personal, non-commercial use, and may not be used for any purpose other than to identify prospective properties consumers may be interested in purchasing. Information is deemed reliable but not guaranteed.
IDX information is provided exclusively for personal, non-commercial use, and may not be used for any purpose other than to identify prospective properties consumers may be interested in purchasing. Information is deemed reliable but not guaranteed.
Ask me questions while you tour the home.