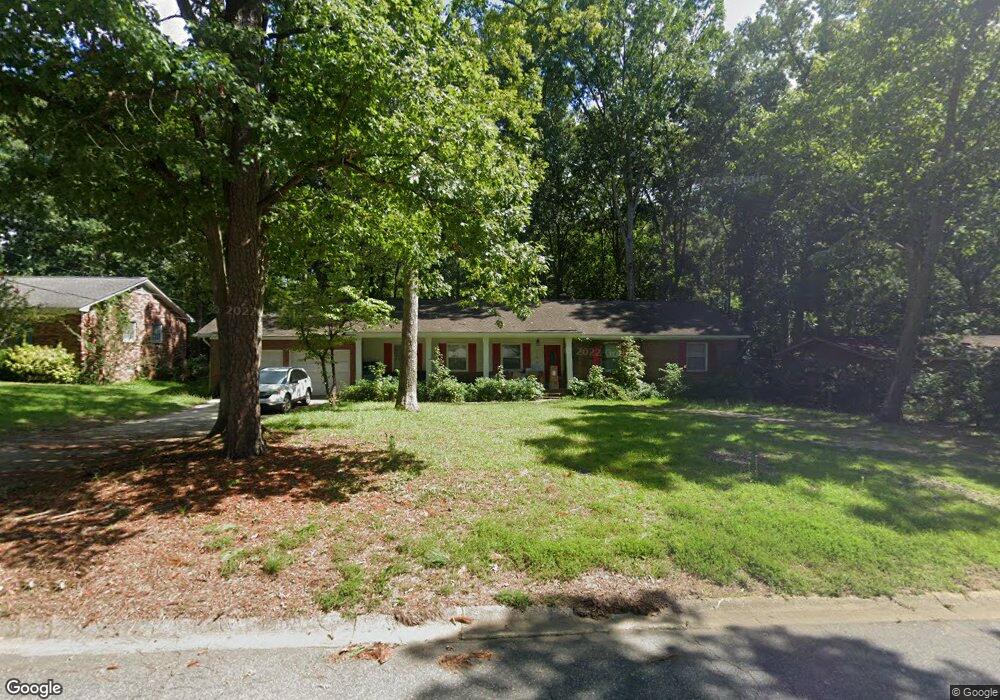
208 Barmount Dr Columbia, SC 29210
Seven Oaks NeighborhoodEstimated Value: $231,000 - $266,000
3
Beds
2
Baths
1,832
Sq Ft
$136/Sq Ft
Est. Value
About This Home
This home is located at 208 Barmount Dr, Columbia, SC 29210 and is currently estimated at $249,076, approximately $135 per square foot. 208 Barmount Dr is a home located in Lexington County with nearby schools including Leaphart Elementary School, Irmo Middle, and Irmo High.
Ownership History
Date
Name
Owned For
Owner Type
Purchase Details
Closed on
Jan 25, 2016
Sold by
Simmons Matthew S
Bought by
Simons Matthew S and Simmons Michael
Current Estimated Value
Purchase Details
Closed on
Feb 14, 2007
Sold by
The Bank Of New York
Bought by
Black Marvin
Home Financials for this Owner
Home Financials are based on the most recent Mortgage that was taken out on this home.
Original Mortgage
$123,000
Interest Rate
6.19%
Mortgage Type
New Conventional
Purchase Details
Closed on
Dec 22, 2006
Sold by
Friedman Eva H
Bought by
Faust Fletcher D and Faust Gail
Home Financials for this Owner
Home Financials are based on the most recent Mortgage that was taken out on this home.
Original Mortgage
$123,000
Interest Rate
6.19%
Mortgage Type
New Conventional
Purchase Details
Closed on
Jun 13, 2003
Sold by
D R Horton Inc
Bought by
Curry J Garrett
Create a Home Valuation Report for This Property
The Home Valuation Report is an in-depth analysis detailing your home's value as well as a comparison with similar homes in the area
Home Values in the Area
Average Home Value in this Area
Purchase History
| Date | Buyer | Sale Price | Title Company |
|---|---|---|---|
| Simons Matthew S | -- | None Available | |
| Simmons Matthew S | $135,000 | None Available | |
| Black Marvin | $101,000 | None Available | |
| Faust Fletcher D | $134,900 | None Available | |
| Curry J Garrett | $151,452 | -- |
Source: Public Records
Mortgage History
| Date | Status | Borrower | Loan Amount |
|---|---|---|---|
| Previous Owner | Faust Fletcher D | $123,000 |
Source: Public Records
Tax History Compared to Growth
Tax History
| Year | Tax Paid | Tax Assessment Tax Assessment Total Assessment is a certain percentage of the fair market value that is determined by local assessors to be the total taxable value of land and additions on the property. | Land | Improvement |
|---|---|---|---|---|
| 2024 | $952 | $6,210 | $1,359 | $4,851 |
| 2023 | $952 | $6,210 | $1,359 | $4,851 |
| 2022 | $972 | $6,210 | $1,359 | $4,851 |
| 2020 | $1,012 | $6,210 | $1,359 | $4,851 |
| 2019 | $897 | $5,400 | $1,200 | $4,200 |
| 2018 | $788 | $5,400 | $1,200 | $4,200 |
| 2017 | $767 | $5,400 | $1,200 | $4,200 |
| 2016 | $743 | $7,637 | $1,800 | $5,837 |
| 2014 | $857 | $5,826 | $1,150 | $4,676 |
| 2013 | -- | $5,830 | $1,150 | $4,680 |
Source: Public Records
Map
Nearby Homes
- 139 Cheshire Dr
- 163 Cheshire Dr
- 326 Townes Rd
- 320 Brookshire Dr
- 224 Linsbury Cir
- 119 Wilkshire Dr
- 3725 Harrogate Rd
- 531 Sulgrave Dr
- 412 Winstaire Dr
- 440 Leton Dr
- 203 Broken Hill Rd
- 107 Southwell Rd
- 612 Lewisham Rd
- 312 Tendrill Ct
- 305 Tendrill Ct
- 219 Ambling Cir
- 105 Ferntree Ct
- 105 Garmony Cir
- 1115 Gardendale Dr
- 319 Valcour Rd
- 214 Barmount Dr
- 202 Barmount Dr
- 203 Blythecreek Ct
- 4 Rose Hill Ct
- 220 Barmount Dr
- 209 Barmount Dr
- 215 Barmount Dr
- 203 Barmount Dr
- 206 Blythecreek Ct
- 221 Barmount Dr
- 124 Barmount Dr
- 129 Barmount Dr
- 128 Cheshire Dr
- 120 Cheshire Dr
- 116 Cheshire Dr
- 212 Blythecreek Ct
- 227 Barmount Dr
- 7 Rose Hill Ct
- 230 Barmount Dr
- 1 Rose Hill Ct