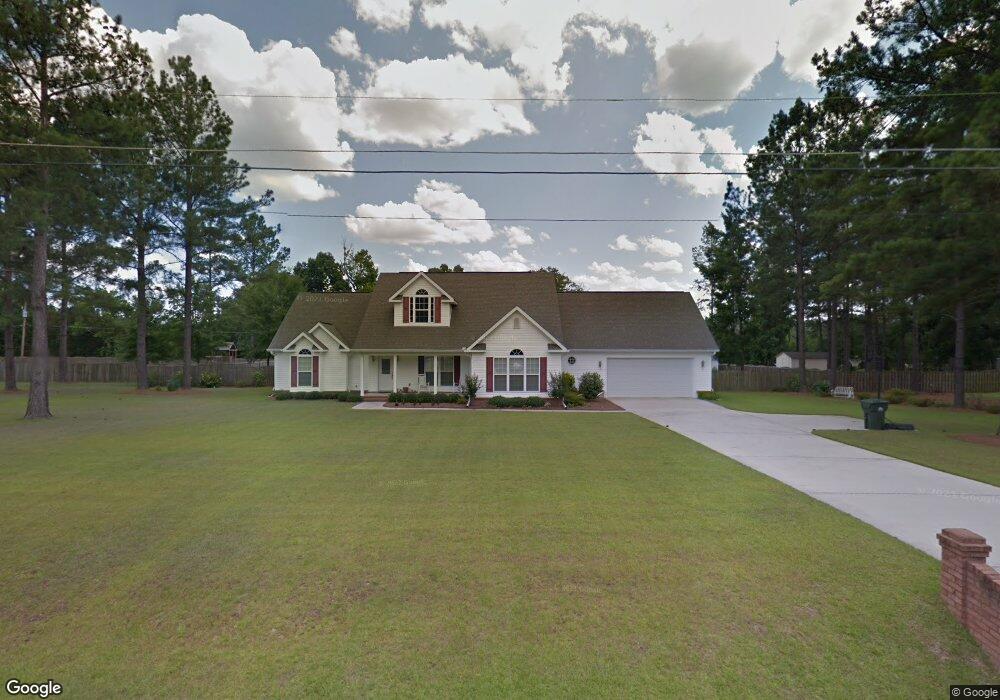
208 Bay Arbor Ln Macon, GA 31216
Estimated Value: $313,123 - $343,000
3
Beds
3
Baths
2,603
Sq Ft
$126/Sq Ft
Est. Value
About This Home
This home is located at 208 Bay Arbor Ln, Macon, GA 31216 and is currently estimated at $328,281, approximately $126 per square foot. 208 Bay Arbor Ln is a home located in Bibb County with nearby schools including Heard Elementary School, Rutland Middle School, and Rutland High School.
Ownership History
Date
Name
Owned For
Owner Type
Purchase Details
Closed on
Apr 21, 2005
Sold by
Psyk Jeffrey T
Bought by
Psyk Jeffery T and Psyk Roberta L
Current Estimated Value
Home Financials for this Owner
Home Financials are based on the most recent Mortgage that was taken out on this home.
Original Mortgage
$168,000
Interest Rate
5.88%
Mortgage Type
New Conventional
Purchase Details
Closed on
Apr 14, 2005
Sold by
Carey Robert S
Bought by
Psyk Jeffery T
Home Financials for this Owner
Home Financials are based on the most recent Mortgage that was taken out on this home.
Original Mortgage
$168,000
Interest Rate
5.88%
Mortgage Type
New Conventional
Purchase Details
Closed on
Apr 9, 2005
Sold by
Gibson Lucy P and Gibson Jake L
Bought by
Gibson Carey Development Co Inc
Home Financials for this Owner
Home Financials are based on the most recent Mortgage that was taken out on this home.
Original Mortgage
$168,000
Interest Rate
5.88%
Mortgage Type
New Conventional
Purchase Details
Closed on
Aug 18, 2004
Purchase Details
Closed on
Jul 7, 2004
Create a Home Valuation Report for This Property
The Home Valuation Report is an in-depth analysis detailing your home's value as well as a comparison with similar homes in the area
Home Values in the Area
Average Home Value in this Area
Purchase History
| Date | Buyer | Sale Price | Title Company |
|---|---|---|---|
| Psyk Jeffery T | -- | None Available | |
| Psyk Jeffery T | $210,000 | None Available | |
| Gibson Carey Development Co Inc | -- | None Available | |
| -- | $20,000 | -- | |
| -- | -- | -- |
Source: Public Records
Mortgage History
| Date | Status | Borrower | Loan Amount |
|---|---|---|---|
| Closed | Psyk Jeffery T | $168,000 |
Source: Public Records
Tax History Compared to Growth
Tax History
| Year | Tax Paid | Tax Assessment Tax Assessment Total Assessment is a certain percentage of the fair market value that is determined by local assessors to be the total taxable value of land and additions on the property. | Land | Improvement |
|---|---|---|---|---|
| 2024 | $2,707 | $113,579 | $12,000 | $101,579 |
| 2023 | $2,250 | $113,579 | $12,000 | $101,579 |
| 2022 | $3,642 | $112,200 | $12,144 | $100,056 |
| 2021 | $3,661 | $103,342 | $10,560 | $92,782 |
| 2020 | $3,740 | $103,342 | $10,560 | $92,782 |
| 2019 | $3,771 | $103,342 | $10,560 | $92,782 |
| 2018 | $5,956 | $103,342 | $10,560 | $92,782 |
| 2017 | $3,610 | $103,342 | $10,560 | $92,782 |
| 2016 | $3,333 | $103,342 | $10,560 | $92,782 |
| 2015 | $4,718 | $103,342 | $10,560 | $92,782 |
| 2014 | $1,575 | $103,342 | $10,560 | $92,782 |
Source: Public Records
Map
Nearby Homes
- 6403 Barfield Rd
- 204 Erin Ln
- 148 Marcar Rd
- 7241 Winterberry Cir
- 7253 Winterberry Cir
- 7209 Winterberry Cir
- 7216 Winterberry Cir
- 7220 Winterberry Cir
- 7212 Winterberry Cir
- 7234 Neal Dr
- 5626 Janeru Cir
- 5459 Robie Dr
- 155 Shetland Pines Dr
- 4072 Sardis Church Rd
- 5190 Mount Pleasant Church Rd
- 5180 Mount Pleasant Church Rd
- 5845 Mount Pleasant Church Rd
- 2 Longleaf Estates Rd
- 1 Longleaf Estates
- 2165 Griffin Dr
- 212 Bay Arbor Ln
- 204 Bay Arbor Ln
- 0 Bay Arbor Ln Unit 7260985
- 0 Bay Arbor Ln Unit 8461462
- 0 Bay Arbor Ln
- 213 Bay Arbor Ln
- 209 Bay Arbor Ln
- 216 Bay Arbor Ln
- 6399 Barfield Rd
- 6385 Barfield Rd
- 6501 Barfield Rd
- 217 Bay Arbor Ln
- 217 Bay Arbor Ln Unit 401
- 6381 Barfield Rd
- 5570 Hartley Bridge Rd
- 225 Bay Arbor Ln
- 6375 Barfield Rd
- 222 Bay Arbor Ln
- 6386 Barfield Rd
- 6380 Barfield Rd