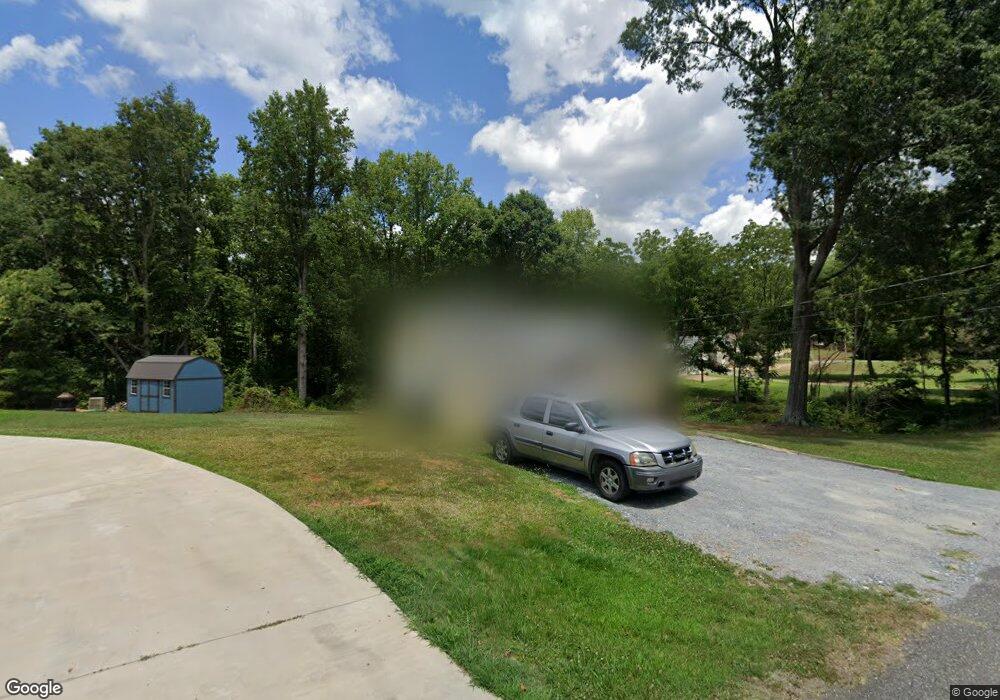
208 Bridges St Kings Mountain, NC 28086
Estimated Value: $171,288 - $207,000
--
Bed
--
Bath
912
Sq Ft
$201/Sq Ft
Est. Value
About This Home
This home is located at 208 Bridges St, Kings Mountain, NC 28086 and is currently estimated at $183,572, approximately $201 per square foot. 208 Bridges St is a home located in Cleveland County with nearby schools including North Elementary School, Kings Mountain Middle, and Kings Mountain Intermediate School.
Ownership History
Date
Name
Owned For
Owner Type
Purchase Details
Closed on
Dec 1, 2022
Sold by
Sadler Christopher Lee and Sadler Laquetta Surrat
Bought by
Sadler Christopher Lee and Sadler Christopher Lee
Current Estimated Value
Purchase Details
Closed on
Jun 9, 2022
Sold by
Sadler Christopher Lee and Sadler Laquetta Surrat
Bought by
Sadler Christopher Lee and Sadler Laquetta Surratt
Purchase Details
Closed on
May 4, 2007
Sold by
Branch Banking & Trust Co
Bought by
Saller Christopher Lee
Home Financials for this Owner
Home Financials are based on the most recent Mortgage that was taken out on this home.
Original Mortgage
$4,600
Interest Rate
6.12%
Mortgage Type
New Conventional
Purchase Details
Closed on
Aug 15, 2006
Sold by
Purirt Michael M
Bought by
Branch Banking & Trust Company
Create a Home Valuation Report for This Property
The Home Valuation Report is an in-depth analysis detailing your home's value as well as a comparison with similar homes in the area
Home Values in the Area
Average Home Value in this Area
Purchase History
| Date | Buyer | Sale Price | Title Company |
|---|---|---|---|
| Sadler Christopher Lee | -- | -- | |
| Sadler Christopher Lee | -- | -- | |
| Sadler Christopher Lee | -- | -- | |
| Sadler Christopher Lee | -- | None Listed On Document | |
| Saller Christopher Lee | $53,000 | None Available | |
| Branch Banking & Trust Company | $49,500 | None Available |
Source: Public Records
Mortgage History
| Date | Status | Borrower | Loan Amount |
|---|---|---|---|
| Previous Owner | Saller Christopher Lee | $4,600 |
Source: Public Records
Tax History Compared to Growth
Tax History
| Year | Tax Paid | Tax Assessment Tax Assessment Total Assessment is a certain percentage of the fair market value that is determined by local assessors to be the total taxable value of land and additions on the property. | Land | Improvement |
|---|---|---|---|---|
| 2025 | $1,353 | $132,036 | $30,694 | $101,342 |
| 2024 | $903 | $75,236 | $18,175 | $57,061 |
| 2023 | $899 | $75,236 | $18,175 | $57,061 |
| 2022 | $861 | $75,236 | $18,175 | $57,061 |
| 2021 | $866 | $75,236 | $18,175 | $57,061 |
| 2020 | $749 | $63,175 | $17,164 | $46,011 |
| 2019 | $749 | $63,175 | $17,164 | $46,011 |
| 2018 | $747 | $63,175 | $17,164 | $46,011 |
| 2017 | $744 | $63,175 | $17,164 | $46,011 |
| 2016 | $745 | $63,175 | $17,164 | $46,011 |
| 2015 | $701 | $60,940 | $14,545 | $46,395 |
| 2014 | $701 | $60,940 | $14,545 | $46,395 |
Source: Public Records
Map
Nearby Homes
- 905 Gantt St
- 200 Lackey St Unit 1-2
- 1003 Ramseur St
- 300 Fulton St
- 312 Fulton St
- 109 Fulton St Unit 9
- 116 Walker St
- 810 4th St
- 808 3rd St
- 207 Morris St
- 405 Clinton Dr
- 205 Stowe Acres
- 522 Waco Rd
- 823 1st St
- 5066 Beargrass Dr
- 223 # Benfield Rd
- 223 Benfield Rd
- 310 Campbell Cir
- 524 Waco Rd
- 213 Benfield Rd