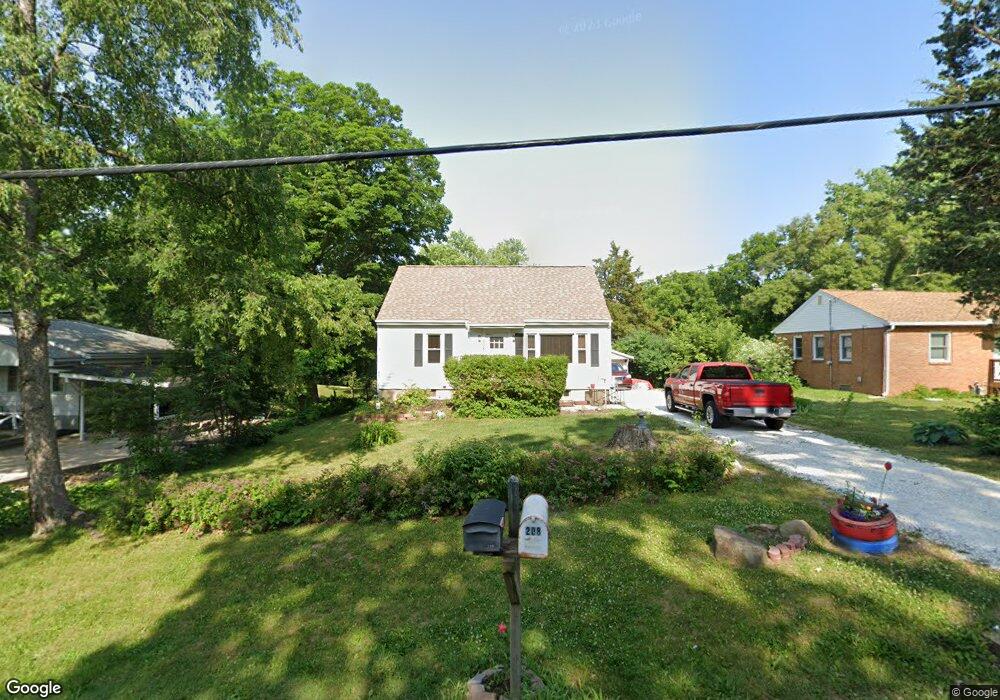
208 Clover Ave East Peoria, IL 61611
Estimated Value: $124,000 - $206,000
2
Beds
1
Bath
1,433
Sq Ft
$109/Sq Ft
Est. Value
About This Home
This home is located at 208 Clover Ave, East Peoria, IL 61611 and is currently estimated at $156,637, approximately $109 per square foot. 208 Clover Ave is a home located in Tazewell County with nearby schools including Woodrow Wilson Elementary School, Glendale Elementary School, and Central Junior High School.
Ownership History
Date
Name
Owned For
Owner Type
Purchase Details
Closed on
Dec 30, 2009
Sold by
Marquart Glenn E and Marquart Nina M
Bought by
Custer Andrew D T
Current Estimated Value
Home Financials for this Owner
Home Financials are based on the most recent Mortgage that was taken out on this home.
Original Mortgage
$73,150
Outstanding Balance
$47,905
Interest Rate
4.9%
Mortgage Type
New Conventional
Estimated Equity
$108,732
Create a Home Valuation Report for This Property
The Home Valuation Report is an in-depth analysis detailing your home's value as well as a comparison with similar homes in the area
Home Values in the Area
Average Home Value in this Area
Purchase History
| Date | Buyer | Sale Price | Title Company |
|---|---|---|---|
| Custer Andrew D T | $77,000 | Chicago Title |
Source: Public Records
Mortgage History
| Date | Status | Borrower | Loan Amount |
|---|---|---|---|
| Open | Custer Andrew D T | $73,150 |
Source: Public Records
Tax History Compared to Growth
Tax History
| Year | Tax Paid | Tax Assessment Tax Assessment Total Assessment is a certain percentage of the fair market value that is determined by local assessors to be the total taxable value of land and additions on the property. | Land | Improvement |
|---|---|---|---|---|
| 2024 | $2,242 | $31,820 | $6,350 | $25,470 |
| 2023 | $2,242 | $29,210 | $5,830 | $23,380 |
| 2022 | $2,088 | $27,020 | $5,390 | $21,630 |
| 2021 | $1,981 | $25,980 | $5,180 | $20,800 |
| 2020 | $1,937 | $25,980 | $5,180 | $20,800 |
| 2019 | $1,924 | $25,980 | $5,180 | $20,800 |
| 2018 | $1,870 | $25,980 | $5,180 | $20,800 |
| 2017 | $1,851 | $25,980 | $5,180 | $20,800 |
| 2016 | $1,827 | $25,980 | $5,180 | $20,800 |
| 2015 | $1,721 | $0 | $0 | $0 |
| 2013 | $1,732 | $25,170 | $5,020 | $20,150 |
Source: Public Records
Map
Nearby Homes