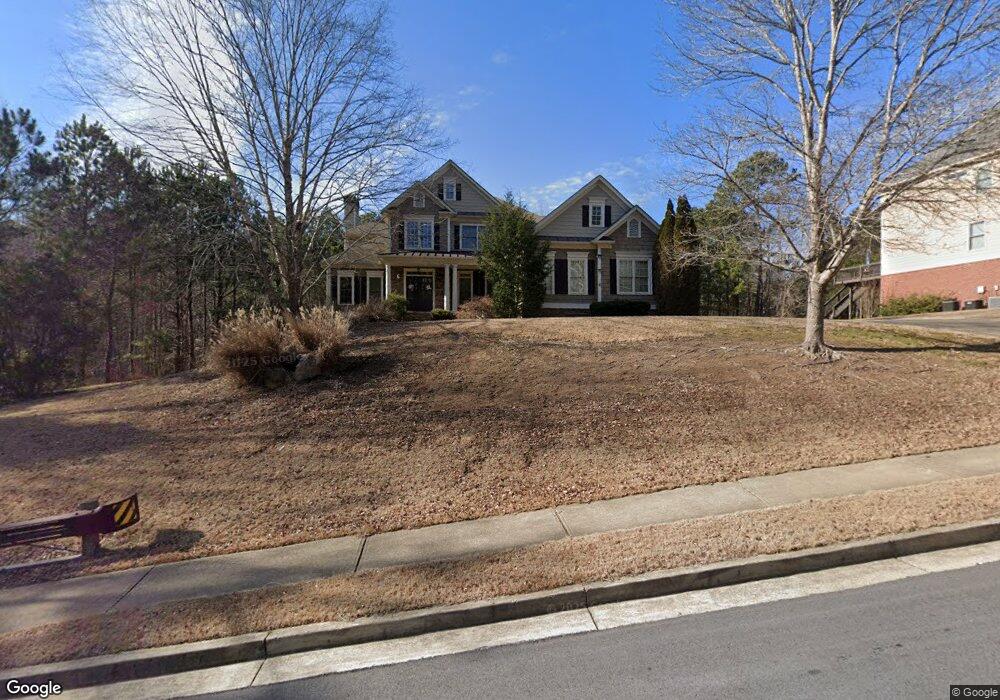
208 Double Branches Ln Unit E49 Dallas, GA 30132
Cedarcrest NeighborhoodEstimated Value: $616,149 - $652,000
4
Beds
4
Baths
3,277
Sq Ft
$193/Sq Ft
Est. Value
About This Home
This home is located at 208 Double Branches Ln Unit E49, Dallas, GA 30132 and is currently estimated at $633,537, approximately $193 per square foot. 208 Double Branches Ln Unit E49 is a home located in Paulding County with nearby schools including W.C. Abney Elementary School, Sammy Mcclure Sr. Middle School, and North Paulding High School.
Ownership History
Date
Name
Owned For
Owner Type
Purchase Details
Closed on
Nov 1, 2018
Sold by
Foster Mary Ellen
Bought by
Briggs Erik J and Briggs Annelise W
Current Estimated Value
Home Financials for this Owner
Home Financials are based on the most recent Mortgage that was taken out on this home.
Original Mortgage
$333,100
Outstanding Balance
$287,404
Interest Rate
4.7%
Mortgage Type
New Conventional
Estimated Equity
$346,133
Purchase Details
Closed on
Mar 29, 2012
Sold by
Temco Associates Llc
Bought by
Foster Daniel S
Purchase Details
Closed on
Jul 27, 2007
Sold by
Sharp Residential Llc
Bought by
Foster Daniel S and Foster Mary E
Home Financials for this Owner
Home Financials are based on the most recent Mortgage that was taken out on this home.
Original Mortgage
$43,350
Interest Rate
9.87%
Mortgage Type
New Conventional
Purchase Details
Closed on
Aug 8, 2006
Sold by
Temco Associates Llc
Create a Home Valuation Report for This Property
The Home Valuation Report is an in-depth analysis detailing your home's value as well as a comparison with similar homes in the area
Home Values in the Area
Average Home Value in this Area
Purchase History
| Date | Buyer | Sale Price | Title Company |
|---|---|---|---|
| Briggs Erik J | $385,000 | -- | |
| Foster Daniel S | -- | -- | |
| Foster Daniel S | $433,500 | -- | |
| -- | $433,500 | -- | |
| -- | $61,000 | -- |
Source: Public Records
Mortgage History
| Date | Status | Borrower | Loan Amount |
|---|---|---|---|
| Open | Briggs Erik J | $333,100 | |
| Previous Owner | -- | $43,350 | |
| Previous Owner | -- | $346,700 |
Source: Public Records
Tax History
| Year | Tax Paid | Tax Assessment Tax Assessment Total Assessment is a certain percentage of the fair market value that is determined by local assessors to be the total taxable value of land and additions on the property. | Land | Improvement |
|---|---|---|---|---|
| 2025 | $5,974 | $243,824 | $26,000 | $217,824 |
| 2024 | $5,953 | $242,560 | $26,000 | $216,560 |
| 2023 | $6,307 | $244,452 | $26,000 | $218,452 |
| 2022 | $6,052 | $203,760 | $26,000 | $177,760 |
| 2021 | $5,101 | $171,760 | $26,000 | $145,760 |
| 2020 | $4,721 | $160,800 | $26,000 | $134,800 |
| 2019 | $4,530 | $152,200 | $26,000 | $126,200 |
| 2018 | $2,837 | $149,120 | $26,000 | $123,120 |
| 2017 | $2,695 | $139,680 | $26,000 | $113,680 |
| 2016 | $2,647 | $139,280 | $26,000 | $113,280 |
| 2015 | $3,799 | $134,560 | $26,000 | $108,560 |
| 2014 | $3,788 | $131,120 | $26,000 | $105,120 |
| 2013 | -- | $109,520 | $26,000 | $83,520 |
Source: Public Records
Map
Nearby Homes
- 64 Red Hawk Way
- 45 Calming Water Trail
- 167 Calming Water Trail
- 56 Stillwater Ln
- 297 Cobblestone Trail
- 96 Treadstone Ln
- 230 Treadstone Ln
- 271 Ivy Hall Ln
- 242 Cobblestone Trail
- 131 Treadstone Ln
- 144 Blackberry Run Trail
- 72 Wagon Oak Trail
- 45 Windflower Ct Unit 2
- 150 Shoal Creek Way
- 46 Red Cedar Way
- 980 Double Branches Ln
- 55 Scarlet Oak Way
- 289 Ryans Point
- 156 Starry Night Way
- 28 Tea Rose Ln
- 208 Double Branches Ln
- 184 Double Branches Ln
- 162 Double Branches Ln
- 173 Double Branches Ln
- 235 Double Branches Ln
- 138 Double Branches Ln
- 270 Double Branches Ln
- 159 Double Branches Ln
- 141 Double Branches Ln
- 275 Double Branches Ln
- 118 Double Branches Ln
- 288 Double Branches Ln
- 125 Double Branches Ln Unit 125
- 45 Red Hawk Way
- 98 Double Branches Ln
- 311 Double Branches Ln
- 306 Double Branches Ln
- 105 Double Branches Ln
- 351 Double Branches Ln
- 67 Red Hawk Way