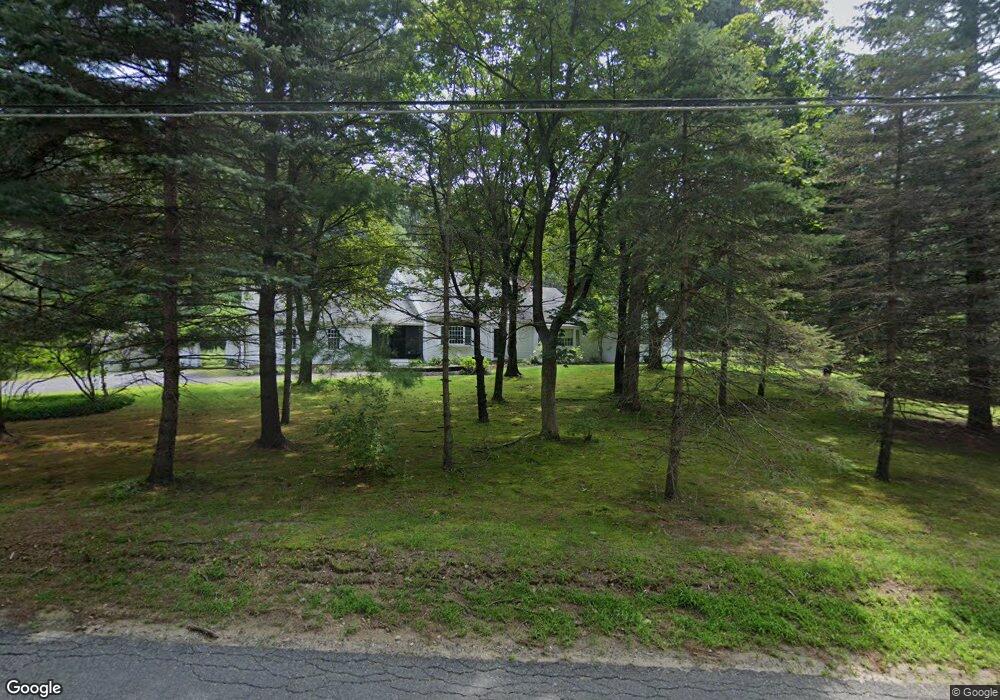
208 Dutton Rd Sudbury, MA 01776
Estimated Value: $1,135,000 - $1,430,000
4
Beds
4
Baths
3,103
Sq Ft
$412/Sq Ft
Est. Value
About This Home
This home is located at 208 Dutton Rd, Sudbury, MA 01776 and is currently estimated at $1,279,511, approximately $412 per square foot. 208 Dutton Rd is a home located in Middlesex County with nearby schools including Peter Noyes Elementary School, Ephraim Curtis Middle School, and Lincoln-Sudbury Regional High School.
Ownership History
Date
Name
Owned For
Owner Type
Purchase Details
Closed on
Nov 19, 2012
Sold by
Callen 4Th John H and Callen Dacia W
Bought by
Callen Dacia W
Current Estimated Value
Purchase Details
Closed on
Jun 25, 2004
Sold by
Coombes Dorothy L and Coombes Robert
Bought by
Callen Dacia W and Callen John H
Home Financials for this Owner
Home Financials are based on the most recent Mortgage that was taken out on this home.
Original Mortgage
$433,000
Interest Rate
6.32%
Mortgage Type
Purchase Money Mortgage
Create a Home Valuation Report for This Property
The Home Valuation Report is an in-depth analysis detailing your home's value as well as a comparison with similar homes in the area
Home Values in the Area
Average Home Value in this Area
Purchase History
| Date | Buyer | Sale Price | Title Company |
|---|---|---|---|
| Callen Dacia W | -- | -- | |
| Callen Dacia W | $758,000 | -- |
Source: Public Records
Mortgage History
| Date | Status | Borrower | Loan Amount |
|---|---|---|---|
| Previous Owner | Callen Dacia W | $433,000 |
Source: Public Records
Tax History
| Year | Tax Paid | Tax Assessment Tax Assessment Total Assessment is a certain percentage of the fair market value that is determined by local assessors to be the total taxable value of land and additions on the property. | Land | Improvement |
|---|---|---|---|---|
| 2025 | $14,584 | $996,200 | $607,800 | $388,400 |
| 2024 | $14,067 | $962,800 | $591,800 | $371,000 |
| 2023 | $14,100 | $894,100 | $535,000 | $359,100 |
| 2022 | $14,005 | $775,900 | $495,800 | $280,100 |
| 2021 | $13,780 | $731,800 | $495,800 | $236,000 |
| 2020 | $13,502 | $731,800 | $495,800 | $236,000 |
| 2019 | $13,107 | $731,800 | $495,800 | $236,000 |
| 2018 | $13,550 | $755,700 | $523,400 | $232,300 |
| 2017 | $13,103 | $738,600 | $519,000 | $219,600 |
| 2016 | $12,684 | $712,600 | $501,400 | $211,200 |
| 2015 | $12,434 | $706,500 | $497,400 | $209,100 |
| 2014 | $12,453 | $690,700 | $485,800 | $204,900 |
Source: Public Records
Map
Nearby Homes
- 53 Pine St
- 30 Kendall Rd
- 0 Boston Post Rd
- 30 Rolling Ln
- 0 Robbins Rd
- 22 Barracks Rd Unit 22
- 62 Hawkins Ln
- 557 Dutton Rd Unit 2
- 16 Parmenter Rd
- 15 Adams Rd
- 11 Great Lake Dr
- 135 Nobscot Dr
- 11 Farmstead Ln Unit 11
- 6 Mountain View Dr
- 173 Nobscot Rd
- 30 Harness Ln
- 168 Blanchette Dr
- 62 Churchill St
- 15 Huckleberry Ln
- 786 Main St
Your Personal Tour Guide
Ask me questions while you tour the home.