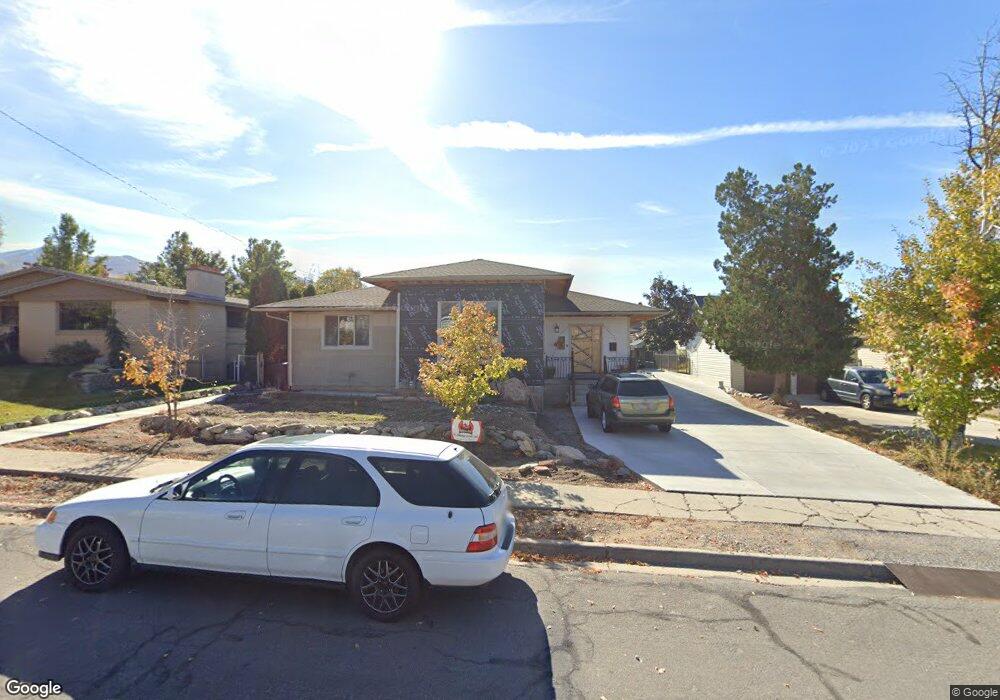
208 E 1100 S Bountiful, UT 84010
Estimated Value: $511,000 - $666,780
3
Beds
2
Baths
2,850
Sq Ft
$210/Sq Ft
Est. Value
About This Home
This home is located at 208 E 1100 S, Bountiful, UT 84010 and is currently estimated at $599,195, approximately $210 per square foot. 208 E 1100 S is a home located in Davis County with nearby schools including Bountiful Elementary School, Millcreek Junior High School, and Bountiful High School.
Ownership History
Date
Name
Owned For
Owner Type
Purchase Details
Closed on
May 30, 1997
Sold by
Jorgensen Brad and Jorgensen Kollette
Bought by
Brimhall Robert C and Brimhall Wendy D
Current Estimated Value
Home Financials for this Owner
Home Financials are based on the most recent Mortgage that was taken out on this home.
Original Mortgage
$128,729
Interest Rate
8.08%
Mortgage Type
FHA
Create a Home Valuation Report for This Property
The Home Valuation Report is an in-depth analysis detailing your home's value as well as a comparison with similar homes in the area
Purchase History
| Date | Buyer | Sale Price | Title Company |
|---|---|---|---|
| Brimhall Robert C | -- | First American Title Co |
Source: Public Records
Mortgage History
| Date | Status | Borrower | Loan Amount |
|---|---|---|---|
| Previous Owner | Brimhall Robert C | $128,729 |
Source: Public Records
Tax History
| Year | Tax Paid | Tax Assessment Tax Assessment Total Assessment is a certain percentage of the fair market value that is determined by local assessors to be the total taxable value of land and additions on the property. | Land | Improvement |
|---|---|---|---|---|
| 2025 | $3,766 | $344,850 | $140,770 | $204,080 |
| 2024 | $3,544 | $335,500 | $128,402 | $207,098 |
| 2023 | $2,505 | $421,000 | $233,811 | $187,189 |
| 2022 | $2,641 | $244,200 | $127,027 | $117,173 |
| 2021 | $2,271 | $320,000 | $166,347 | $153,653 |
| 2020 | $2,022 | $285,000 | $141,105 | $143,895 |
| 2019 | $2,111 | $279,000 | $142,442 | $136,558 |
| 2018 | $1,887 | $255,000 | $139,480 | $115,520 |
| 2016 | $1,631 | $119,350 | $59,798 | $59,552 |
| 2015 | $1,607 | $111,045 | $59,798 | $51,247 |
| 2014 | $1,552 | $110,300 | $59,798 | $50,502 |
| 2013 | -- | $105,595 | $43,945 | $61,650 |
Source: Public Records
Map
Nearby Homes
- 380 E 1500 S
- 323 Peach Ln
- 141 E 1650 S
- 545 S 100 E
- 275 E Peach Ln S
- 650 S Main St Unit 7107
- 650 S Main St Unit 6206
- 650 S Main St Unit 4104
- 650 S Main St Unit 9106
- 456 E 500 S
- 255 E 400 S
- 1350 S 200 W
- 357 S 100 E
- 34 W 400 S
- 1820 S 50 W
- 631 E 1700 S
- 32 W 400 S
- 795 Abby Ln Unit 5
- 1314 S 200 W Unit 19
- 861 E Millbrook Way
Your Personal Tour Guide
Ask me questions while you tour the home.