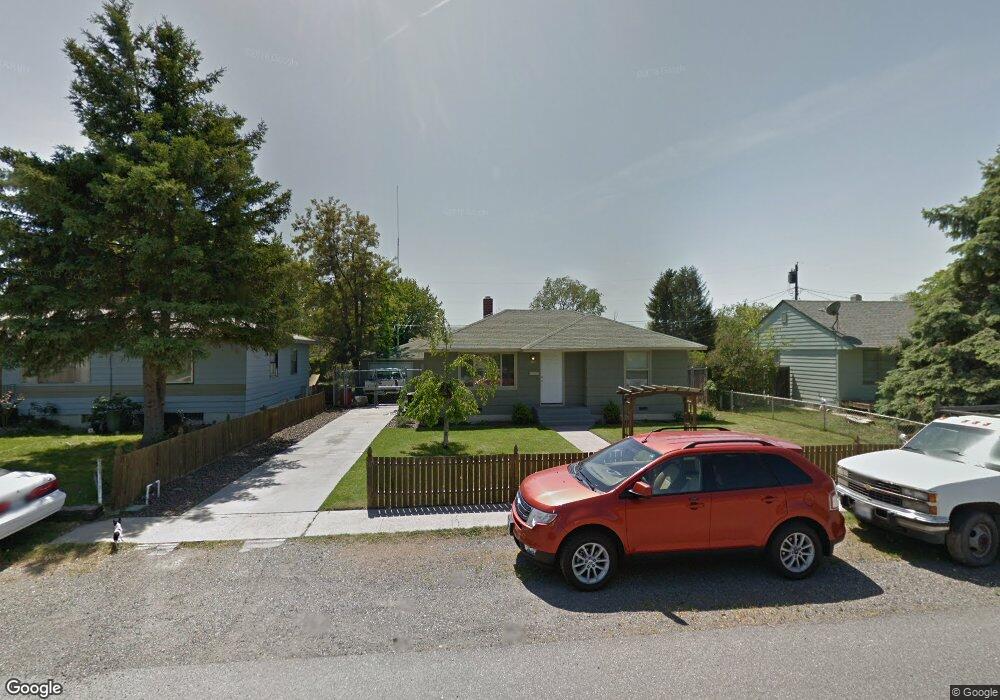
208 E 14th Ave Unit Check to see about K Kennewick, WA 99337
Estimated Value: $222,000 - $297,607
3
Beds
1
Bath
862
Sq Ft
$307/Sq Ft
Est. Value
About This Home
This home is located at 208 E 14th Ave Unit Check to see about K, Kennewick, WA 99337 and is currently estimated at $264,652, approximately $307 per square foot. 208 E 14th Ave Unit Check to see about K is a home located in Benton County with nearby schools including Washington Elementary School, Park Middle School, and Kennewick High School.
Ownership History
Date
Name
Owned For
Owner Type
Purchase Details
Closed on
Nov 24, 2014
Sold by
Lopez Hilario J and Lopez Araceli
Bought by
Rivera Jose Luis
Current Estimated Value
Home Financials for this Owner
Home Financials are based on the most recent Mortgage that was taken out on this home.
Original Mortgage
$0
Interest Rate
3.89%
Mortgage Type
Unknown
Purchase Details
Closed on
May 16, 2006
Sold by
Lowry James E
Bought by
Lopez Hilario J and Morfin Araceli
Home Financials for this Owner
Home Financials are based on the most recent Mortgage that was taken out on this home.
Original Mortgage
$84,651
Interest Rate
6.52%
Mortgage Type
FHA
Purchase Details
Closed on
Sep 20, 2005
Sold by
Lowry Deborah K
Bought by
Lowry James E
Create a Home Valuation Report for This Property
The Home Valuation Report is an in-depth analysis detailing your home's value as well as a comparison with similar homes in the area
Home Values in the Area
Average Home Value in this Area
Purchase History
| Date | Buyer | Sale Price | Title Company |
|---|---|---|---|
| Rivera Jose Luis | $95,000 | Frontier Title & Escrow Co | |
| Lopez Hilario J | $89,900 | Chicago Title | |
| Lowry James E | -- | Cascade Title |
Source: Public Records
Mortgage History
| Date | Status | Borrower | Loan Amount |
|---|---|---|---|
| Closed | Rivera Jose Luis | $0 | |
| Open | Rivera Jose Luis | $91,066 | |
| Previous Owner | Lopez Hilario J | $84,651 |
Source: Public Records
Tax History Compared to Growth
Tax History
| Year | Tax Paid | Tax Assessment Tax Assessment Total Assessment is a certain percentage of the fair market value that is determined by local assessors to be the total taxable value of land and additions on the property. | Land | Improvement |
|---|---|---|---|---|
| 2024 | $2,148 | $241,830 | $70,000 | $171,830 |
| 2023 | $2,148 | $230,370 | $70,000 | $160,370 |
| 2022 | $1,789 | $184,550 | $70,000 | $114,550 |
| 2021 | $1,612 | $155,740 | $40,000 | $115,740 |
| 2020 | $1,662 | $136,290 | $25,000 | $111,290 |
| 2019 | $1,500 | $136,290 | $25,000 | $111,290 |
| 2018 | $1,499 | $122,940 | $25,000 | $97,940 |
| 2017 | $1,388 | $102,420 | $25,000 | $77,420 |
| 2016 | $1,304 | $102,420 | $25,000 | $77,420 |
| 2015 | $1,306 | $94,480 | $22,000 | $72,480 |
| 2014 | -- | $94,480 | $22,000 | $72,480 |
| 2013 | -- | $94,480 | $22,000 | $72,480 |
Source: Public Records
Map
Nearby Homes
- 205 E 15th Ave
- 2731 S Alder St
- 2707 S Alder St
- 451 E 15th Place
- 721 E 15th Ave
- 415 E 8th Ave
- 602 E 8th Ave
- 305 W 10th Ave
- 325 W 11th Ave
- 1631 S Dayton Place
- 818 S Juniper St
- 316 W 21st Ave
- 302 E 23rd Ave
- 2504 S Beech St
- 1826 S Washington St
- 811 E 4th Ave
- 408 S Gum St
- 120 E 26th Ave
- 26 E 3rd Ave
- 1111 E 6th Ave
- 208 E 14th Ave Unit Ready to Sell!
- 208 E 14th Ave
- 206 E 14th Ave
- 210 E 14th Ave
- 215 E 15th Ave
- 204 E 14th Ave
- 209 E 15th Ave
- 217 E 15th Ave
- 218 E 14th Ave
- 209 E 14th Ave
- 207 E 15th Ave
- 211 E 14th Ave
- 223 E 15th Ave
- 221 E 15th Ave
- 202 E 14th Ave
- 207 E 14th Ave
- 221 E 14th Ave
- 205 E 14th Ave
- 122 E 14th Ave
- 1334 S Cedar St