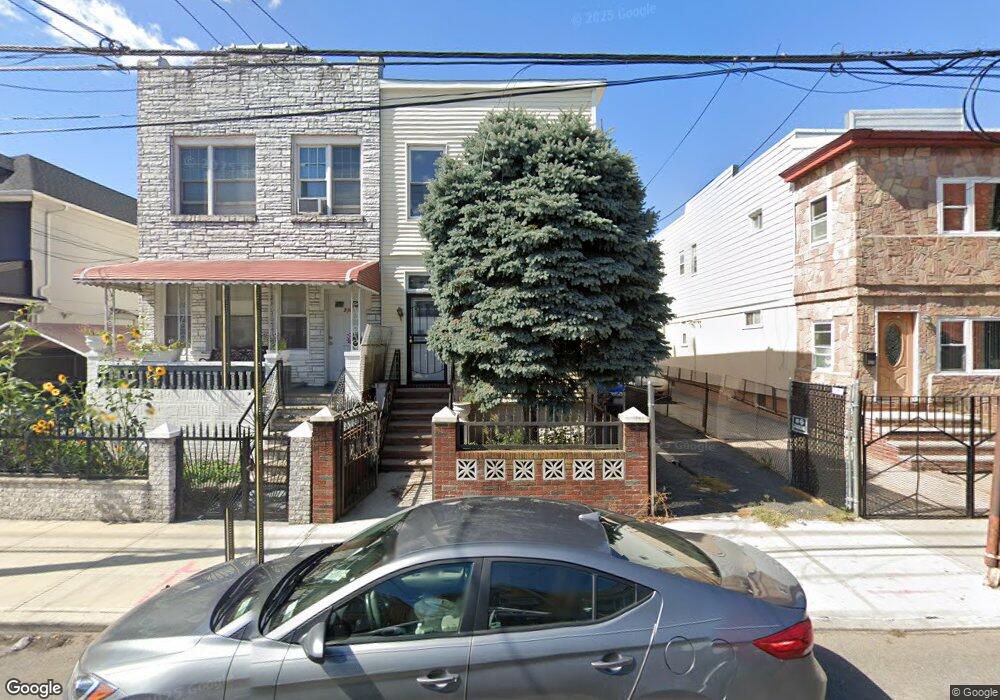
208 E 42nd St Unit 2nd Fl Brooklyn, NY 11203
East Flatbush NeighborhoodEstimated Value: $792,174 - $885,000
3
Beds
1
Bath
1,692
Sq Ft
$494/Sq Ft
Est. Value
About This Home
This home is located at 208 E 42nd St Unit 2nd Fl, Brooklyn, NY 11203 and is currently estimated at $836,294, approximately $494 per square foot. 208 E 42nd St Unit 2nd Fl is a home located in Kings County with nearby schools including PS 235 Janice Marie Knight School, East Flatbush Community Research School, and East Flatbush Ascend Charter School.
Ownership History
Date
Name
Owned For
Owner Type
Purchase Details
Closed on
Jun 30, 2017
Sold by
Greenpoint Group Properties Llc
Bought by
Edmond Nivard and Jacques Jessica Jean
Current Estimated Value
Home Financials for this Owner
Home Financials are based on the most recent Mortgage that was taken out on this home.
Original Mortgage
$662,138
Outstanding Balance
$550,879
Interest Rate
3.94%
Mortgage Type
Purchase Money Mortgage
Estimated Equity
$285,415
Purchase Details
Closed on
Sep 30, 2016
Sold by
Brooks Rudolph R
Bought by
Greenpoint Group Properties Llc
Home Financials for this Owner
Home Financials are based on the most recent Mortgage that was taken out on this home.
Original Mortgage
$282,000
Interest Rate
3.48%
Mortgage Type
Purchase Money Mortgage
Purchase Details
Closed on
Mar 11, 2004
Sold by
Salinger Rosemarie and Simpson Horace
Bought by
Brooks Rudolph R
Home Financials for this Owner
Home Financials are based on the most recent Mortgage that was taken out on this home.
Original Mortgage
$198,250
Interest Rate
5.65%
Mortgage Type
Purchase Money Mortgage
Purchase Details
Closed on
Aug 11, 2001
Sold by
Peller Harold and Simpson Dorothy Lwt
Bought by
Simpson Horace and Salinger Rosemarie
Create a Home Valuation Report for This Property
The Home Valuation Report is an in-depth analysis detailing your home's value as well as a comparison with similar homes in the area
Home Values in the Area
Average Home Value in this Area
Purchase History
| Date | Buyer | Sale Price | Title Company |
|---|---|---|---|
| Edmond Nivard | $685,000 | -- | |
| Greenpoint Group Properties Llc | $250,000 | -- | |
| Brooks Rudolph R | $85,000 | -- | |
| Simpson Horace | -- | -- |
Source: Public Records
Mortgage History
| Date | Status | Borrower | Loan Amount |
|---|---|---|---|
| Open | Edmond Nivard | $662,138 | |
| Previous Owner | Greenpoint Group Properties Llc | $282,000 | |
| Previous Owner | Brooks Rudolph R | $198,250 |
Source: Public Records
Tax History Compared to Growth
Tax History
| Year | Tax Paid | Tax Assessment Tax Assessment Total Assessment is a certain percentage of the fair market value that is determined by local assessors to be the total taxable value of land and additions on the property. | Land | Improvement |
|---|---|---|---|---|
| 2025 | $6,272 | $44,400 | $15,360 | $29,040 |
| 2024 | $6,272 | $45,060 | $15,360 | $29,700 |
| 2023 | $5,983 | $43,860 | $15,360 | $28,500 |
| 2022 | $5,882 | $43,980 | $15,360 | $28,620 |
| 2021 | $6,154 | $34,980 | $15,360 | $19,620 |
| 2020 | $2,886 | $36,660 | $15,360 | $21,300 |
| 2019 | $5,444 | $40,560 | $15,360 | $25,200 |
| 2018 | $5,005 | $24,552 | $11,748 | $12,804 |
| 2017 | $4,705 | $24,552 | $12,204 | $12,348 |
| 2016 | $4,561 | $24,367 | $12,304 | $12,063 |
| 2015 | $2,634 | $22,988 | $14,856 | $8,132 |
| 2014 | $2,634 | $21,687 | $16,265 | $5,422 |
Source: Public Records
Map
Nearby Homes
- 221 E 42nd St
- 4211 Snyder Ave
- 4312 Snyder Ave
- 266 E 43rd St
- 984 Troy Ave
- 878 Albany Ave
- 125 E 42nd St
- 263 E 39th St
- 824 Troy Ave
- 4513 Snyder Ave
- 554 Linden Blvd
- 385 E 46th St
- 517 W 46th St Unit 201
- 517 W 46th St Unit 601
- 519 E 46th St
- 976 Schenectady Ave
- 266 E 37th St
- 4721 Church Ave
- 380 E 48th St
- 4801 Church Ave