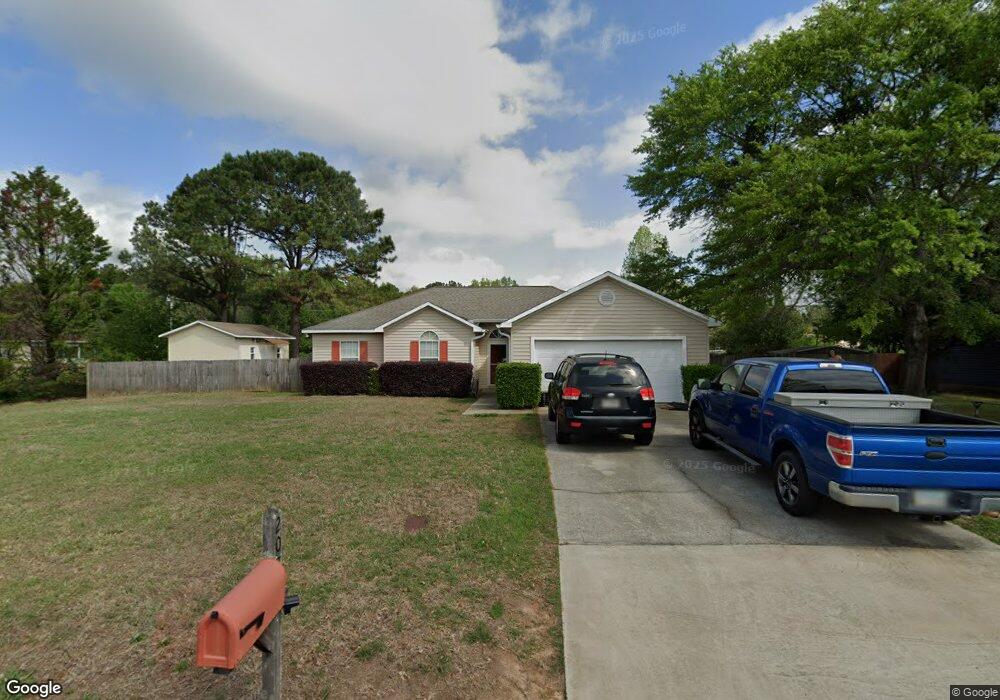
208 E Pointe Cir Kathleen, GA 31047
Estimated Value: $221,305 - $239,000
3
Beds
2
Baths
1,382
Sq Ft
$165/Sq Ft
Est. Value
About This Home
This home is located at 208 E Pointe Cir, Kathleen, GA 31047 and is currently estimated at $228,326, approximately $165 per square foot. 208 E Pointe Cir is a home located in Houston County with nearby schools including Matthew Arthur Elementary School, Bonaire Middle School, and Veterans High School.
Ownership History
Date
Name
Owned For
Owner Type
Purchase Details
Closed on
Apr 30, 2008
Sold by
Gilbane Peter Jason
Bought by
Gilbane Peter Jason and Gilbane Samantah B
Current Estimated Value
Home Financials for this Owner
Home Financials are based on the most recent Mortgage that was taken out on this home.
Original Mortgage
$121,250
Outstanding Balance
$74,551
Interest Rate
5.84%
Mortgage Type
Purchase Money Mortgage
Estimated Equity
$153,775
Purchase Details
Closed on
Sep 27, 2007
Sold by
Bell John Ea
Bought by
Pettis Anna
Purchase Details
Closed on
Sep 18, 2002
Sold by
Cendant Mobility Financial Cor
Bought by
Bell John E
Purchase Details
Closed on
Apr 18, 1996
Sold by
Rolling Rock Enterprises Inc
Bought by
Shell Michael W
Purchase Details
Closed on
Aug 2, 1995
Sold by
L A Development Inc
Bought by
Rolling Rock Enterprises Inc
Create a Home Valuation Report for This Property
The Home Valuation Report is an in-depth analysis detailing your home's value as well as a comparison with similar homes in the area
Home Values in the Area
Average Home Value in this Area
Purchase History
| Date | Buyer | Sale Price | Title Company |
|---|---|---|---|
| Gilbane Peter Jason | -- | None Available | |
| Gilbane Peter Jason | $125,000 | None Available | |
| Pettis Anna | $104,500 | None Available | |
| Bell John E | $91,000 | -- | |
| Cendant Mobility Financial Corp | $91,000 | -- | |
| Shell Michael W | $87,000 | -- | |
| Rolling Rock Enterprises Inc | $9,900 | -- |
Source: Public Records
Mortgage History
| Date | Status | Borrower | Loan Amount |
|---|---|---|---|
| Open | Gilbane Peter Jason | $121,250 |
Source: Public Records
Tax History
| Year | Tax Paid | Tax Assessment Tax Assessment Total Assessment is a certain percentage of the fair market value that is determined by local assessors to be the total taxable value of land and additions on the property. | Land | Improvement |
|---|---|---|---|---|
| 2025 | $1,436 | $65,720 | $8,000 | $57,720 |
| 2024 | $1,494 | $62,440 | $8,000 | $54,440 |
| 2023 | $1,276 | $52,800 | $8,000 | $44,800 |
| 2022 | $1,240 | $51,320 | $8,000 | $43,320 |
| 2021 | $1,131 | $46,560 | $8,000 | $38,560 |
| 2020 | $1,108 | $45,400 | $8,000 | $37,400 |
| 2019 | $1,108 | $45,400 | $8,000 | $37,400 |
| 2018 | $1,108 | $45,400 | $8,000 | $37,400 |
| 2017 | $1,109 | $45,400 | $8,000 | $37,400 |
| 2016 | $1,111 | $45,400 | $8,000 | $37,400 |
| 2015 | $1,113 | $45,400 | $8,000 | $37,400 |
| 2014 | -- | $45,400 | $8,000 | $37,400 |
| 2013 | -- | $43,800 | $6,800 | $37,000 |
Source: Public Records
Map
Nearby Homes
- 122 Eastview Ave
- 110 Bella Ct
- 105 Bella Ct
- 438 Newport Ave
- 204 Amberley Ct
- 123 Amberley Ct
- 203 Amberley Ct
- 207 Amberley Ct
- 519 Bristleleaf Path
- 518 Bristleleaf Path
- 117 Black Birch Ln
- 524 Bristleleaf Path
- 0 Sandbed Road Hwy 247 Rd
- 515 Bristleleaf Path
- 516 Bristleleaf Path
- 115 Black Birch Ln
- 517 Bristleleaf Path
- 200 Emberwood Way
- 522 Bristleleaf Path
- 532 Bristleleaf Path
- 204 E Pointe Cir
- 3734 Moody Rd
- 214 E Pointe Cir
- 3730 Moody Rd
- 207 E Pointe Cir
- 301 E Pointe Ct
- 213 E Pointe Cir
- 205 E Pointe Cir
- 305 E Pointe Ct
- 217 E Pointe Cir
- 3726 Moody Rd
- 221 E Pointe Cir
- 201 E Pointe Cir
- E E Pointe Cir
- 3722 Moody Rd
- 139 E Pointe Cir
- 300 E Pointe Ct
- 304 E Pointe Ct
- 3718 Moody Rd
- 3729 Moody Rd
Your Personal Tour Guide
Ask me questions while you tour the home.