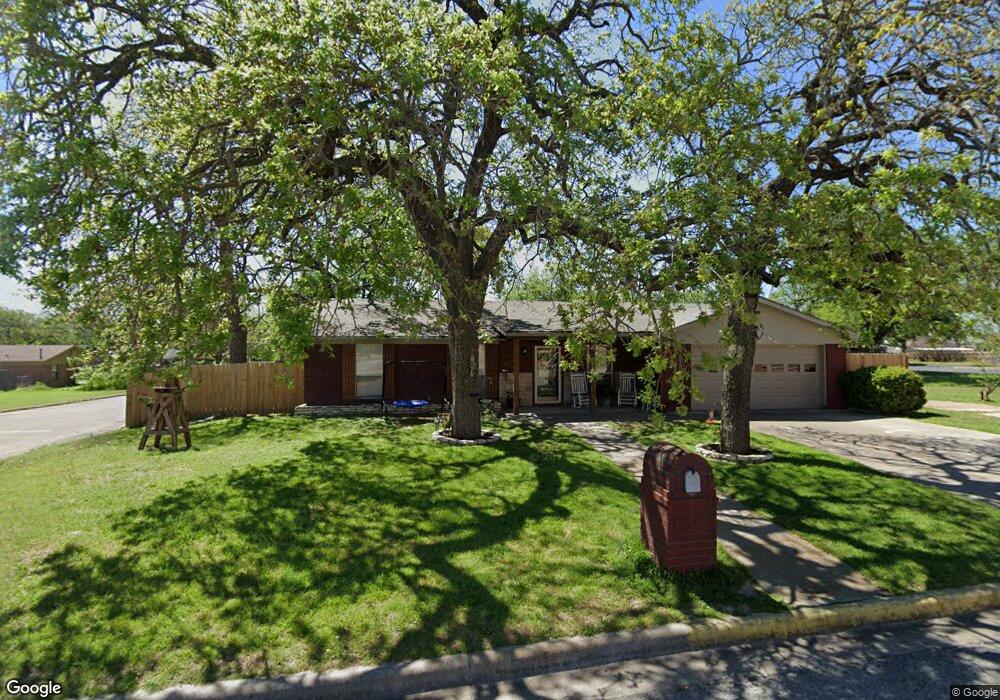
208 Edna St Weatherford, TX 76086
Estimated Value: $293,788 - $319,000
--
Bed
--
Bath
1,796
Sq Ft
$171/Sq Ft
Est. Value
About This Home
This home is located at 208 Edna St, Weatherford, TX 76086 and is currently estimated at $306,447, approximately $170 per square foot. 208 Edna St is a home located in Parker County with nearby schools including Seguin Elementary School, Tison Middle School, and Weatherford High School.
Ownership History
Date
Name
Owned For
Owner Type
Purchase Details
Closed on
Dec 8, 2017
Sold by
Finley Curtis
Bought by
Ames Edward and Ames Rachel
Current Estimated Value
Purchase Details
Closed on
Sep 21, 2017
Sold by
Ames Edward C and Ames Rachel
Bought by
Finley Curtis
Purchase Details
Closed on
May 26, 2017
Sold by
Chandler Todd A
Bought by
Miller Hayden Russell and Chandler Ashley Brooke
Purchase Details
Closed on
Dec 23, 2009
Sold by
Finley Curtis and Finley Frana
Bought by
Ames Edward C and Ames Rachel
Purchase Details
Closed on
Mar 25, 2008
Sold by
Ames Edward C and Ames Rachel
Bought by
Finley Curtis and Finley Frana
Home Financials for this Owner
Home Financials are based on the most recent Mortgage that was taken out on this home.
Original Mortgage
$75,000
Interest Rate
5.72%
Mortgage Type
Seller Take Back
Purchase Details
Closed on
Oct 10, 1986
Bought by
Miller Vikki D
Create a Home Valuation Report for This Property
The Home Valuation Report is an in-depth analysis detailing your home's value as well as a comparison with similar homes in the area
Home Values in the Area
Average Home Value in this Area
Purchase History
| Date | Buyer | Sale Price | Title Company |
|---|---|---|---|
| Ames Edward | -- | None Available | |
| Finley Curtis | -- | None Available | |
| Miller Hayden Russell | -- | None Available | |
| Ames Edward C | $75,000 | None Available | |
| Finley Curtis | -- | None Available | |
| Miller Vikki D | -- | -- |
Source: Public Records
Mortgage History
| Date | Status | Borrower | Loan Amount |
|---|---|---|---|
| Previous Owner | Finley Curtis | $75,000 |
Source: Public Records
Tax History Compared to Growth
Tax History
| Year | Tax Paid | Tax Assessment Tax Assessment Total Assessment is a certain percentage of the fair market value that is determined by local assessors to be the total taxable value of land and additions on the property. | Land | Improvement |
|---|---|---|---|---|
| 2025 | $4,027 | $288,960 | -- | -- |
| 2024 | $4,027 | $262,691 | -- | -- |
| 2023 | $4,027 | $238,810 | $0 | $0 |
| 2022 | $4,816 | $217,100 | $15,000 | $202,100 |
| 2021 | $5,037 | $217,100 | $15,000 | $202,100 |
| 2020 | $4,607 | $190,690 | $15,000 | $175,690 |
| 2019 | $4,463 | $190,690 | $15,000 | $175,690 |
| 2018 | $4,075 | $158,880 | $15,000 | $143,880 |
| 2017 | $4,168 | $158,880 | $15,000 | $143,880 |
| 2016 | $3,789 | $144,010 | $15,000 | $129,010 |
| 2015 | $3,188 | $144,010 | $15,000 | $129,010 |
| 2014 | $2,943 | $125,520 | $15,000 | $110,520 |
Source: Public Records
Map
Nearby Homes
- 712 N Walnut St
- 708 N Walnut St
- 306 Edna St
- 209 Throckmorton St
- 706 N Walnut St
- 207 Throckmorton St
- 205 Throckmorton St
- 706 N Elm St
- 308 Edna St
- 301 Throckmorton St
- 305 Throckmorton St
- 310 Edna St
- 201 Throckmorton St
- 118 Edna St
- 311 Throckmorton St
- 312 Edna St
- tbd Throckmorton St
- 119 Edna St
- 312 Throckmorton St
- 612 N Walnut St